
All investigated genes showed significantly different methylation, or trends towards it in both hypothalamus and cerebellum. There was no difference between the two tissue types.
For the data analysis, melting values were compared between races using Mann-Whitney U and Student's t-test.
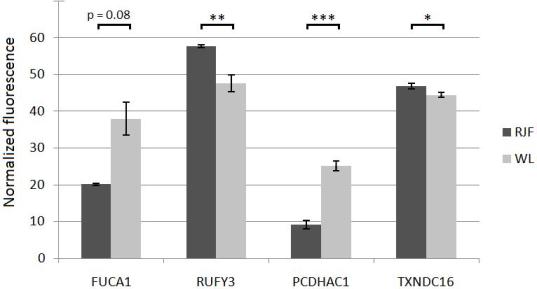
Mean value fluorescence data from diencephalon for Red Junglefowl (RJF) and White Leghorn (WL), with standard error calculations represented as error bars. Three genes show significantly differential methylation. As seen, both FUCA1 and RUFY3 show a larger sample variation in WL than in RJF. The normalized fluorescence is specific within each tested gene, so methylation degrees are not comparable between genes in this figure. (* = p<0.05; ** = p<0.01; *** = p<0.001).
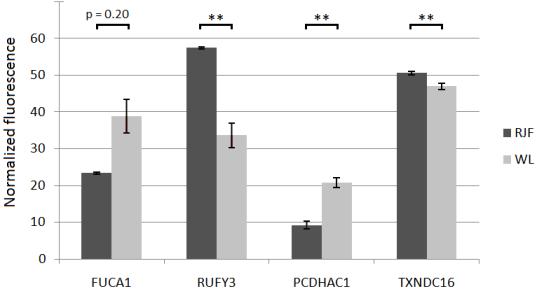
Mean value fluorescence data from cerebellum for Red Junglefowl (RJF) and White Leghorn (WL), with standard error calculations represented as error bars. RUFY3, PCDHAC1 and TXNDC16 show significant differential methylation. Normalized fluorescence is specific within each tested gene, so methylation degrees are not comparable between genes. (** = p<0.01).
Responsible for this page:
Director of undergraduate studies Biology
Last updated:
06/07/11