
Results
Quantitiative real-time PCR
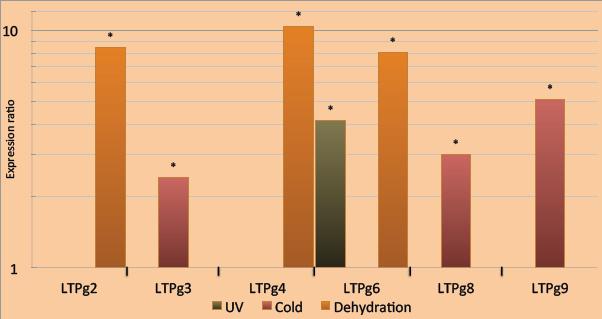
An upregulation was seen in of the genes PpLTPg6 during UV-B radiation stress, in PpLTPg3, PpLTPg8 and PpLTPg9 during cold stress, and in PpLTPg2, PpLTPg4 and PpLTPg6 during dehydration stress.
The graph below shows all the significantlly upregulated genes.
Phylogenetic tree
Additionally, a phylogenetic tree was constructed to show the relationship between the upregulated genes (see below).
The green lines indicate the type G genes, while the red lines indicate the type D gene. PpLTPg2, PpLTPg3, PpLTPg4, PpLTPg6, PpLTPg8 and PpLTPg9 all seem to share a common origin, while PpLTPg1, PpLTPg5, PpLTPg7 and PpLTPg10 seem to share a different common origin. Interestingly, the genes PpLTPg2, PpLTPg3, PpLTPg4, PpLTPg6, PpLTPg8 and PpLTPg9, who all were upregulated in some of the abiotic stresses, are all found in the same branch

Responsible for this page:
Director of undergraduate studies Biology
Last updated:
06/06/11