
Data analysis
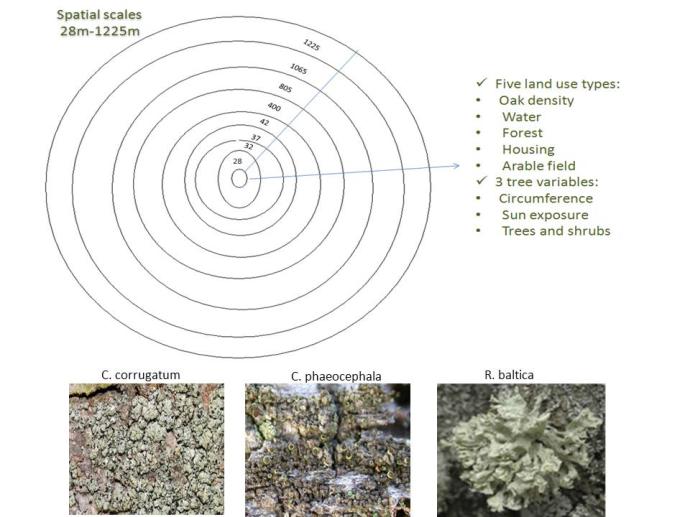
Three most frequent individual lichen species patterns and richness on oaks were analyzed. For each species 28 models (with tree and land use variables) were run, in order to find the best model according to the Akaike information criterion (AIC) values. We used stepwise (oak density + tree variables + land use) to sequentially find out the AIC values, each scale (28-1225m). So, minimum AIC value which is measure of model fit was chosen for each species, hence used as a best explained model to find significant variables explaining species occurrence. All the variables that included in the final model were tested for determining (positive or negative effect) for each species.
Responsible for this page:
Director of undergraduate studies Biology
Last updated:
05/23/11