
Results & Discussion
PCR screening

G=gene specific amplification, T=T-DNA amplification. The second and fourth wells and their corresponding bands (T) represent the PCR fragments obtained using T-DNA primer and a gene-specific primer (0.6 kbp). The wild-type was used as a positive and negative control, therefore it has only a gene-specific amplified PCR fragment (0.9 kbp).
Homozygous (HM) mutants were only found for the tpk5-e mutant during screenings.
ETR activity
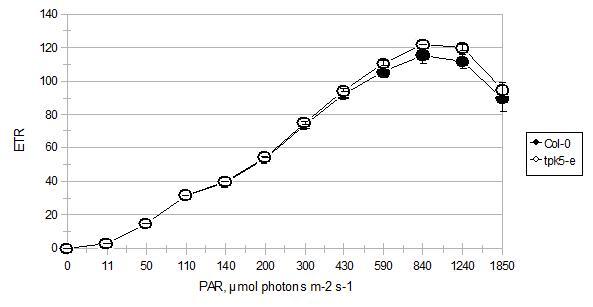
A comparison of the electron transport rate in 4 hour light-adapted tpk5-e mutant and wild-type (Col-0) plants, of which their leaves were measured on the top side. Each point represents the mean ±SE of seven measured leaves from three different plants of each plant type. Where error bars are missing, it is considered that the error was smaller than the symbol's size; p≥0.05
This mean that there was No statistical significant difference in ETR activity when comparing the tpk5-e mutant with the wild-type.
Oxygen evolution

A CO2 -saturated photosynthetic oxygen evolution irradiance-response curve measured on detached leaves from both mutant (tpk5-e) and wild-type (Col-0). Each point represents the mean ±SE of three different measured leaves. Where error bars are missing, it is considered that the error was smaller than the symbol's size: p<0.05 for photosynthetic activity radiation (PAR) values 500, 800, 1200 and 2000.
This means that the O2-evolution decreased in the tpk5-e mutant but only during high light stress
Chlorophyll amount
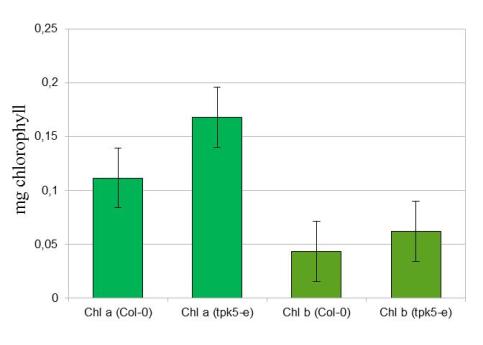
The amount of both chlorophyll pigments a and b measured from isolated thylakoids. Each point represents the mean ±SE of four measurements of isolated thylakoids from both wild-type and tpk5-e mutant. No statistical difference could be validated when comparing the pigments:. p ≥ 0.05
Responsible for this page:
Director of undergraduate studies Biology
Last updated:
05/22/11