
Cellular response, ELI Spot data
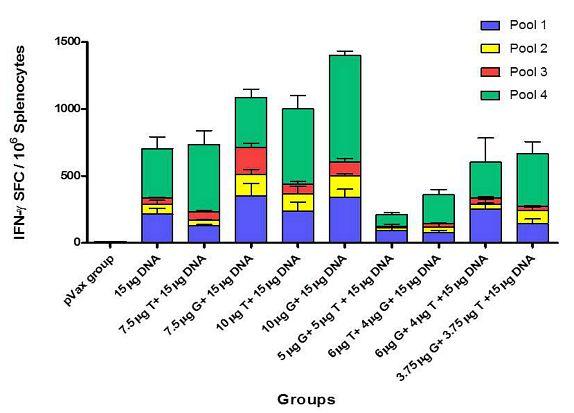
The four different peptide pools used are indicated in the graph and the data obtained are represented as means and standard deviation of the means. The base levels of response obtained from the pVax (control/naive) immunized group is also shown.
On day 35 of the immunization schedule, the mice were sacrificed by cervical dislocation method (in which the animal’s neck was tightly held against the table and the base of the tail was pulled for dislocating the cervix) and their spleens were isolated to perform immunological assays in order to determine the cellular response. A dosing study using various concentrations of adjuvant was performed in order to determine the concentration corresponding to an enhanced immunogenicity.
The above graph i llustrates the different level of responses obtained when GITRL and TWEAK were used separately and in combination at various concentrations respectively. The different pools used namely Pool 1, Pool 2, Pool 3 and Pool 4 refer to the peptide pools of 15mer peptides that were specific against the HIV-1 antigen used in the study. The Y axis denotes the IFN-γ (Interferon-gamma) Spot Forming Cells (SFC) per million splenocytes whereas the X axis represents the different groups of animals that were used in the study.
It can be noticed that an increased response is produced by the GITRL and TWEAK co-vaccinated groups at both 7.5µg and 10µg concentrations respectively when compared to that produced when vaccinated with HIV-1DNA alone. Considering the TWEAK co-administered groups, the 10µg TWEAK co-vaccinated group has elicited approximately a two-fold higher response (with 1100 Spot Forming Cells) when compared to that produced by the parent vaccine (DNA only) immunized group (~700 Spot Forming Cells). Similarly, a 2.5 fold increase in the level of cellular response was conferred by the 10µg GITRL co-immunized group (~1500 Spot Forming Cells) of animals when compared to the DNA (parent vaccine) vaccinated group.
Responsible for this page:
Director of undergraduate studies Biology
Last updated:
05/18/12