
Results
Of the 59 dogs included in this study 44 % (26 dogs; 15 males and 11 females) passed the behavioural test.
Dogs that passed the behavioural test showed a tendency for a higher score in Trainability (p = 0.078) and a tendency for that the dog had lived with other animals (i.e. dogs, cats, horses, rabbits/guinea pigs, birds) (p = 0.066). If the dog however, failed the behavioural test thay showed a significant higher score for Stranger Directed Fear (p = 0.006), Non-Social Fear (p = 0.005), and Dog Directed Fear (p = 0.021). Tha failing dogs also had a significant higher number for "Average hours being activated (p =0.001) and for "Mounting (sexually) objects" (p =0.012). There were also a tendency for a higher score for "Urinating when left home alone" (p = 0.058). (See Table 1 for mean ±SE)

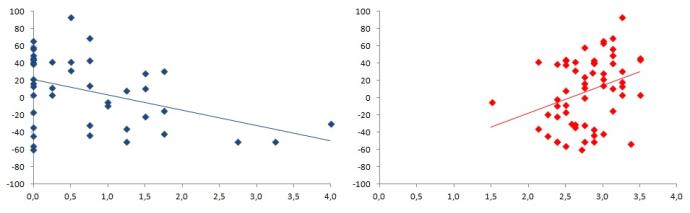
The Index value was significant negatively correlated with Stranger Directed Fear (R = -0.40, N = 58), Non-Social Fear ( R = -0.39, N = 59), and Dog Directed Fear (R = -0.41, N = 43) and significant positively correlated with Trainability (R = 0.32, N = 59), “Hyperactive, restless, has trouble settling down” (R = 0.31, N =59), “Chases/follows shadows, light spots, etc.” (R = 0.27, N = 59), and “Average of hours left home alone per day” (R = 0.27, N = 58). There was also a tendency that Index value was positively correlated with “Chews at inappropriate objects” (R = 0.23, N = 59). (For examples of correlations see Fig. 1.)
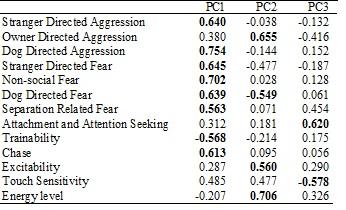
A PCA was done at the categories from the C-BARQ to see if they could be clustered and to get less varables to correlate to the Index value. From the PCA, 5 factors with eigenvalues greater than 1 were indentified. However, there is a clear decrease in the slope after the third factor only the three first factors are used in further analysis. Together the three factors (see Table. 2.) accounted for 57.2 % of the variance. The first factor (PC1), describes dogs which are aggressive and insecure. The second factor (PC2), describes dogs that have a high level of energy. Finally, the third factor (PC3), descries dogs that have a high attachment level.
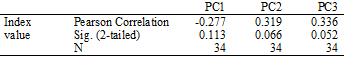
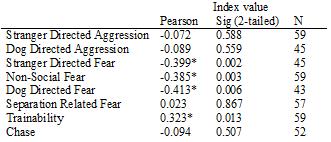
The factors were then used in correlation to the Index value to see if the Index value could be explained by the factors. There were no significant results, but tendencies for PC2 and PC3 (see Table. 3.). However, since the N-value is low in the PCA a correlation with the highest/lowest loaded numbers in PC1 (see Table. 2.) to see if there were any significant differences. There were significant differences for Stranger Directed Fear, Non-social Fear, Dog Directed Fear and Trainability (see Table. 4.)
Responsible for this page:
Director of undergraduate studies Biology
Last updated:
05/14/13