
Results & Discussion
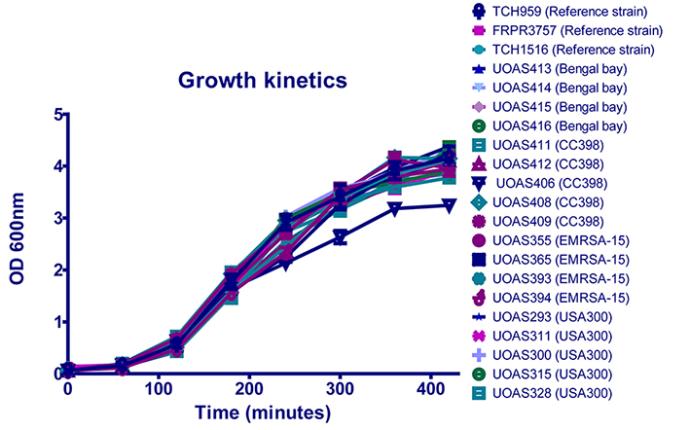
Growth kinetics
Growth kinetic experiments were set up to make sure that all isolates have similar prerequisites to grow in the caterpillars. The experiments were set up in duplicate and were repeated three times for each isolate on separate days. The growth kinetics of all tested strains was similar for all isolates except for CC398 UOAS406, which grew slower in TSB. This implies that UOAS406 also grows slower in the caterpillars. However, the survival, CHI score and CFU results show a high virulence for UOAS406 implying that UOAS406 does not grow slower in the caterpillars.
Survival
Studies of the effect that bacterial inoculation of S. aureus has in the G. mellonella animal model have earlier been represented by percent survival of caterpillars in a survival curve diagram (Chua et al., 2011a, Gao et al., 2010, Peleg et al., 2009, Mylonakis et al., 2005). Survival curve diagrams for respective strain are shown in the figure below.
In the percent survival diagrams the decreasing health of the caterpillars over time is clearly visible. Most isolates within each strain are similar with a more or less virulent isolate clearly diverging from the others. These are the more virulent UOAS413 in the Bengal Bay isolates and the less virulent UOAS412 in the CC398 isolates.
Between the graphs, CC398 is clearly the fastest killing strain with a very steep curve at an early time point (21 hrs). The USA300 isolates have a more gradual curve as have the Bengal Bay isolates whereas the slope of the EMRSA-15 isolates are steeper.
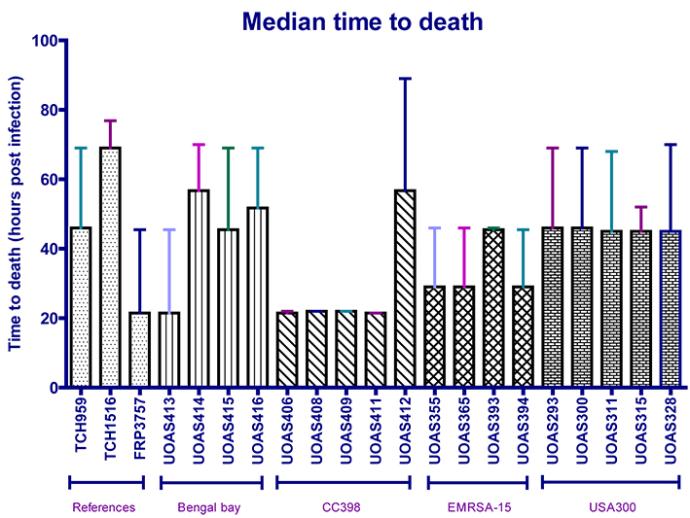
Another way of visualising the survival of the caterpillars is to show the time to death for caterpillars injected with the different S. aureus isolates. By visualising the data in this way, it is easier to compare the virulence between isolates.
In comparison to median time to death, the percent survival diagrams visualise the health of the caterpillar over time whereas the median time to death are more readily compared between isolates. Also in the median time to death data, the UOAS413 in the Bengal Bay isolates and the UOAS412 in the CC398 isolates are prominently differing from the other isolates in respective strain. The CC398 is strikingly the most virulent strain also in the median time to death data (except for UOAS412). Further, the USA300 and Bengal Bay isolates (except for UOAS413) are least virulent in both the median time to death and the percent survival curves.
Survival curves have been utilised in the literature for visualising virulence in G. mellonella and constitutes a clear overview of the fitness decrease of the caterpillars. These data are analogous to the median time to death data which highlights the same isolates and strains as more/less virulent.

Caterpillar health index scoring system
The CHI scoring system opens up for novel ways of presenting the data. In a graph showing points and connecting lines for the median CHI score for each isolate over time, the decreasing health of the caterpillars is easily visualised. It is an efficient way of evaluating the virulence of the different isolates in the G. mellonella model.
A difference to percent survival curves is that the CHI score curves take into consideration how healthy the caterpillar appear to be when still alive. It does not show the time to death per caterpillar as percent survival curves do, but rather shows the median time to death for all caterpillars injected with the specific isolate (when the curve reaches zero, but occasionally dead caterpillars have a couple of points in the CHI scoring system when they die why the time point when the CHI score curve reaches zero points is not the exact median time to death).
In the CHI score graphs it is evident that UOAS412 is prominently less virulent than the other CC398 isolates and that UOAS413 is more virulent than remaining Bengal Bay isolates. The fast killing process of the CC398 isolates (excluding UOAS412) and UOAS413 (Bengal Bay) are shown as steep curves.
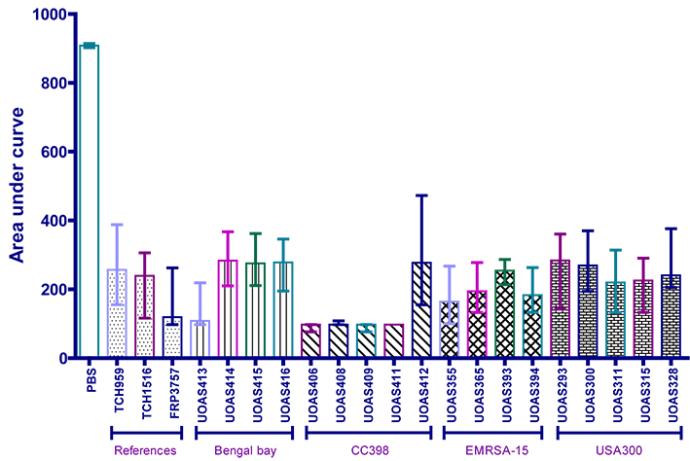
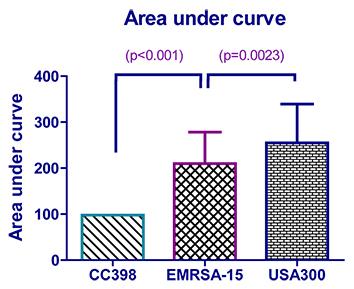
Even though the median CHI score graphs is an efficient way of visualising the virulence, it is harder to compare the graphs between each other. To compare the virulence in the G. mellonella model between isolates, the area under the curve (AUC) for the CHI score graphs was used. By calculating the AUC for the CHI score graphs, statistical tests could be performed on the CHI score data. AUC is merely used as a means of comparison and do not signify anything in particular in this case. The median CHI score AUC per isolate is shown in the figure below.
In accordance with the survival results and CHI score graphs, the CHI score AUC shows a high virulence for UOAS413 (Bengal Bay), a decreased virulence for UOAS412 (CC398), a low virulence for the USA300 isolates and a slightly higher virulence for the EMRSA-15 isolates.

Colony forming units (CFU) in dead caterpillars
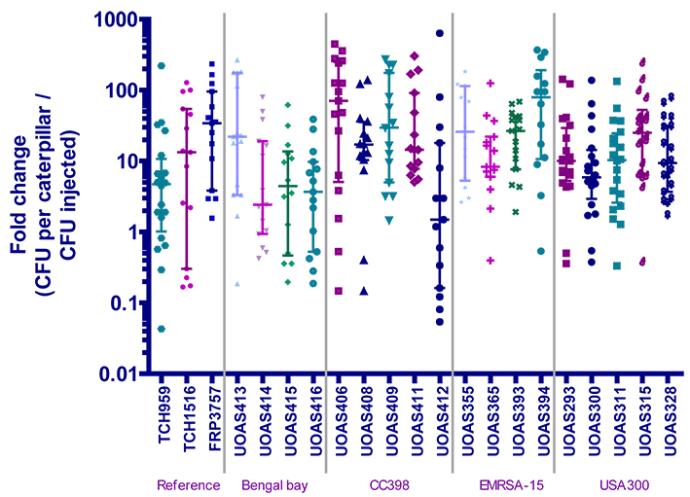
Another means of comparing the strains is to measure the bacterial burden of the caterpillar at the time of death by analysing the colony forming units (CFUs) of the dead caterpillars. After a caterpillar had been categorised dead, it was mashed, dissolved in PBS and applied in droplets on TSA plates in different dilutions. Upon incubation for up to 24 hours, the colonies on the plates were counted and a CFU value calculated of how many cells the caterpillar contained. This CFU value was also normalised to the number of cells injected in the caterpillar, as calculated from the CFUs of the bacterial inoculum preparation. This gives a comparable measurement termed fold change.
When analysing the difference between isolates belonging to the same strain, the EMRSA-15 and USA300 isolates seem to have a similar fold change, whereas there is one isolate that differs from the others belonging to Bengal bay (UOAS413) respective CC398 (UOAS412). The reference isolates seem to differ, as they should.
When analysing the difference between the groups of isolates composing the different strains, the Bengal bay isolates seem to have a lower fold change than the isolates belonging to the other three strains. CC398 seem to have the highest fold change, followed by EMRSA-15 and USA300.
Statistical analysis
Differences in CHI score area under curve
The CHI score AUCs of the EMRSA-15 isolates appear to level in between those of the CC398 and USA300 isolates. One-tailed Mann-Whitney comparisons were conducted between EMRSA-15 and USA300 respective EMRSA-15 and CC398 to find out if they have significantly different CHI score AUC.
To detect significant differences between the strains rather than the individual isolates, the data for AUC was added for isolates belonging to the same strain. For EMRSA-15, the CHI score AUC for each individual caterpillar (36 per isolate) was added for isolates UOAS355, UOAS365, UOAS393 and UOAS394. For USA300, the CHI score AUC for each individual caterpillar (51 per isolate) was added for isolates UOAS293, UOAS300, UOAS311, UOAS315 and UOAS328. For CC398, the CHI score AUC per individual caterpillar (36 per isolate) was added for UOAS406, UOAS408, UOAS409 and UOAS411.
A one-tailed Mann-Whitney comparison showed that there was a statistically significant difference between EMRSA-15 and USA300 (p=0.0023), see figure below. CC398 was then compared to EMRSA-15 and the difference was found to be significantly different (p<0.0001).
Differences in fold change
Kruskal-Wallis and Dunn’s multiple comparison tests were used to analyse differences in fold change between isolates within each strain. No statistically significant differences were found between Bengal bay isolates (UOAS413, UOAS414, UOAS415 and UOAS416), EMRSA-15 isolates (UOAS355, UOAS365, UOAS393 and UOAS394) or USA300 isolates (UOAS293, UOAS300, UOAS311, UOAS315 and UOAS328) respectively. A significant difference between CC398 UOAS406 and UOAS412 (p<0.01) was found in comparison between the CC398 isolates (UOAS406, UOAS408, UOAS409, UOAS411 and UOAS412). A significant difference was also found between the reference isolates TCH959 and FRP3757 (p<0.05) in comparison between the reference isolates TCH959, TCH1516 and FRP3757.
The significant difference in fold change found between the CC398 isolates UOAS406 and UOAS412 reflect the dissimilarity of UOAS412 to the other isolates belonging to CC398. The distinctiveness of UOAS412 is also evident for percent survival, median time to death and CHI score AUC.
These results show that UOAS412 are distinct from the other CC398 isolates and that isolates belonging to the same strain in general show a similar fold change in the CFU assay.
Kruskal-Wallis and Dunn’s multiple comparison tests were also used to compare the fold change between the strains. In this comparison, the added fold change data from all isolates within a strain was used. For USA300, normalised CFU values were added (18-20 per isolate, 97 in total) for UOAS293, UOAS300, UOAS311, UOAS315 and UOAS328. For EMRSA-15, the normalised CFU values (14-15 per isolate, 58 in total) were added for UOAS355, UOAS365, UOAS393 and UOAS394. For CC398, values for the normalised CFU values (15-17 per isolate, 62 in total) were added for UOAS406, UOAS408, UOAS409 and UOAS411. For Bengal Bay, the normalised CFU values (14-15 per isolate, 59 in total) were added for UOAS413, UOAS414, UOAS415 and UOAS416.
Bengal bay was found to be statistically different from both EMRSA-15 (p<0.001) and CC398 (p<0.001) but no statistical difference were found between Bengal bay and USA300. CC398 was also found to be statistically different from USA300 (p<0.05).
To compare the results for the CHI score AUC statistical tests with fold change statistical tests, the same comparisons were conducted. A one-tailed Mann-Whitney showed a statistically significant difference (p=0.0042) between USA300 and EMRSA-15 and no significant difference between CC398 and EMRSA-15, see figure below.
The one-tailed Mann-Whitney comparison of CHI score AUC and fold change between the isolates belonging to EMRSA-15 respective USA300 both showed to be significantly different. The CHI score AUC for EMRSA-15 is significantly lower than for USA300, whereas the fold change is significantly higher for EMRSA-15 than for USA300. A low CHI score AUC represent a rapid death of the caterpillar, i.e. the bacterial isolate injected has a high virulence whereas a high fold change indicate a high bacterial growth from injection of the caterpillar to its death.
The one-sided Mann-Whitney comparison of fold change between CC398 and EMRSA-15 did not show a significant difference, whereas the same comparison of CHI score AUC showed that CC398 had a significantly smaller AUC. This implies that the smaller AUC for CC398 as compared to EMRSA-15 does not depend on a higher growth rate of the bacteria in the caterpillar.

Gene count
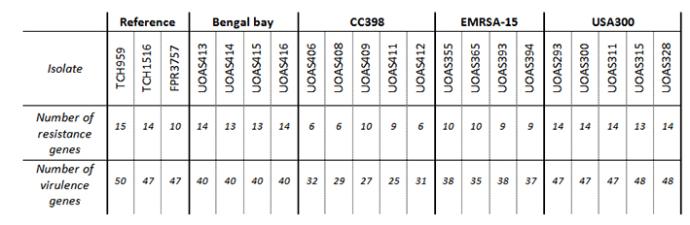
For genotyping of the MRSA isolates, bacterial samples were sent for analysis with diagnostic DNA microarrays. Apart from species control, the array analyses the prescence of known virulence and resistance genes in MRSA.
The virulence genes were grouped depending on their function. The two main groups were genes related to resistance and genes related to virulence. For every isolate the genes belonging to each group were counted.
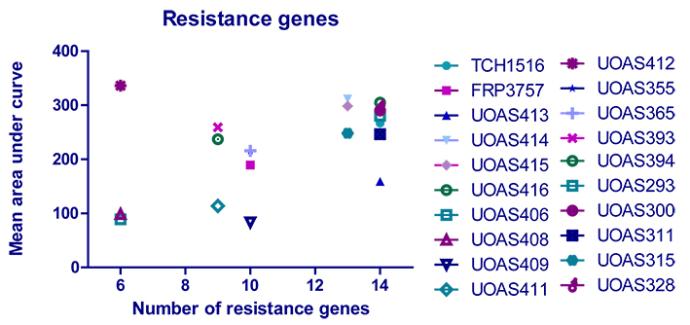
The number of genes for resistance respective for virulence were calculated and correlated to the CHI score AUC mean value for respective isolate. The correlation graphs can be viewed below. A Pearson product moment correlation coefficient (r) was calculated for the correlations using Graph Pad Prism. For the correlation of resistance genes to area under curve, the r2 value was not significant. The correlation of virulence genes to CHI score AUC was significant (p<0.01) and the r2 value was 0.3219, which signifies a dependent correlation. This implies that a high number of virulence genes corresponds to a large CHI score AUC (low virulence), which suggests that a high number of virulence genes can be a disadvantage for MRSA infecting G. mellonella. Since the S. aureus natural environment is the human nasal cavity, this does not necessarily entail that a high number of virulence genes is a disadvantage in human infection.

Responsible for this page:
Director of undergraduate studies Biology
Last updated:
05/08/13