
Methods
Study sites
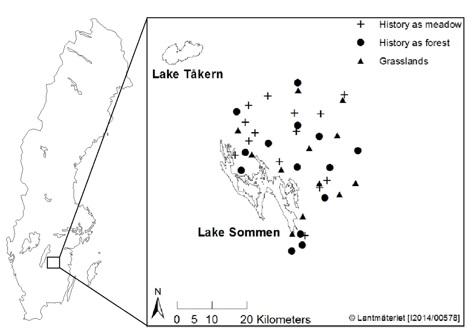
The study was performed in southern Sweden in the province of Östergötland. Forty sites were investigated, 12 semi-natural grasslands and 28 mature coniferous production forests which correspond to approximately 80-120 years. The forests were evenly divided between forests with a management history as meadow or as forest during 1870.
The species richness of herbaceous plants and grasses were investigated once in one-hundred circular sample plots (radius 1 m) at each site between early August and late October, 2014. Within each sample plot plant presence was recorded and plant frequency was calculated as the number of sample plots which a species was presence. To classify species as indicators for semi-natural grasslands, indicator system by Ekstam & Forshed (1992) and Bertilsson & Paltto (2003) were used.
Habitat factors
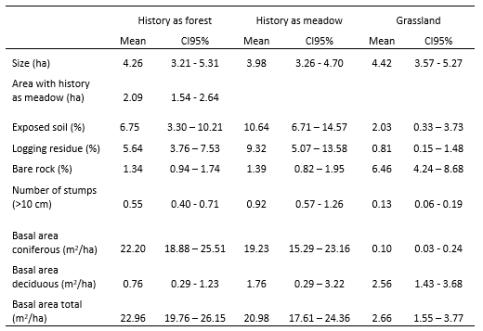
At every third sample plot a number of habitat factors were investigated within an area of 100 m2 (circle with radius 5.64 m). These factors were investigated to ensure that there was no systematic difference between the study sites, since it can affect the result. For example, logging residues can limit the available growing-space and exposed mineral soil can be important for colonization and germination of seeds.
Plant traits
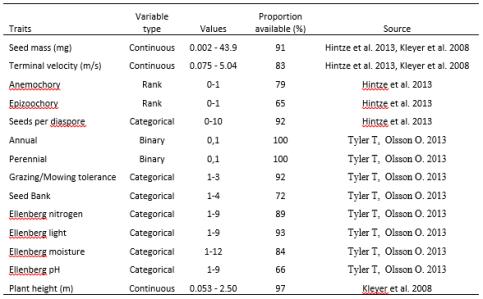
To investigate if different plant traits were associated with a certain land-use history several traits related to dispersal, persistence and habitat requirements were selected for analysis. A total of 14 traits were chosen for the analysis and data were taken from the LEDA Trait base (Kleyer et al. 2008), the Dispersal and Diaspore Database (Hintze et al. 2013) and a database on traits of plants in southern Sweden (Tyler & Olsson 2013). In these databases some species are missing trait values, therefore, all traits could not be assigned to all species. However, at least 65% (range 65 -100%) of each trait could be assigned of all species.
Statistical analyses
All statistical analyses were performed in the program R (R Core Team 2013). To investigate each individual species preference for forest type odds ratio (OR) was calculated. OR = (a / b) / (c / d), where (a / b) is the probability of finding species n in a forest with a history as forest and (c / d) is the probability of finding species n in a forest with a history as meadow. The natural logarithm of the odds ratio and the corresponding 95% confidence interval was then calculated, ln (OR) 1.96 * √ (1/a + 1/b + 1/c + 1/d). A negative ln (OR) indicates preference towards forest with a history as meadow compared to as forest. Only species present in at least two forest sites were included in this analysis to reduce the influence of rare species.
To analyse the relationship between forests and clear-cuts with a history as forest or as meadow as well as reference grasslands, a nonmetric multidimensional scaling (NMDS) was performed. The NMDS was based on the abundance of 212 plant species at 88 sites (12 grasslands, 28 forests with different history and 48 clear-cuts with different history). To investigate if certain plant species trait are associated with a certain site type, trait values were also included in the NMDS. In order to do this a community weighted mean (CWM) for all traits was calculated. CWM is the mean trait value of all species present in the community (site) weighted by their relative abundances. Before the CWM was calculated the species abundance data was log-transformed in order to reduce the influence of dominating species.
Responsible for this page:
Director of undergraduate studies Biology
Last updated:
05/18/15