
Zebra and wildebeest
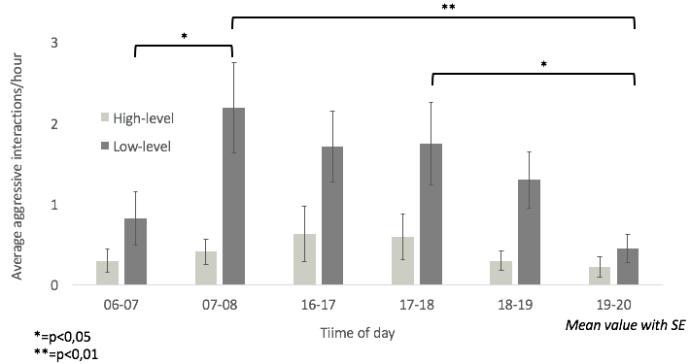
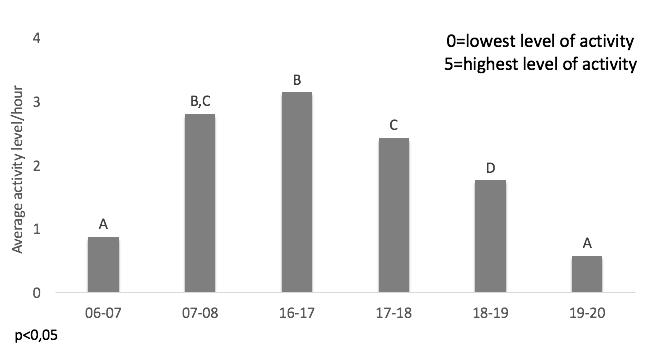
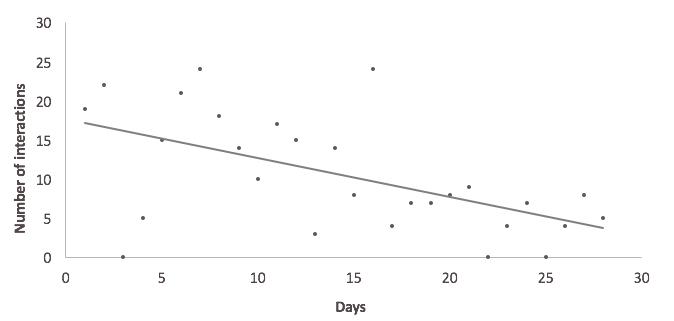
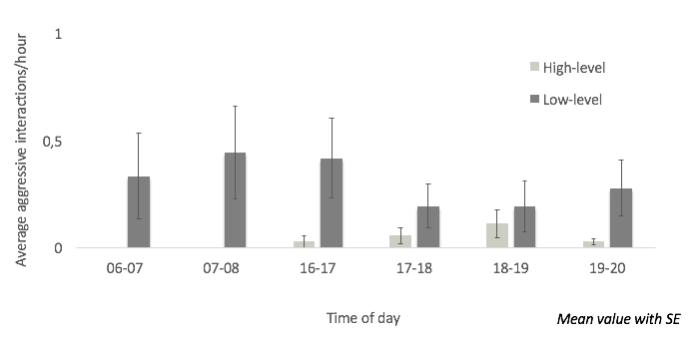
Figure 1 show average interspecific aggression among zebra and wildebeest where there is significant differences in which time during the day the agonistic behaviours occurred. A peak is shown during the time before the staff arrives and also during the time after they left for the day. This is also the time the wildebeest is most active as well (figure 2) indicating that when the wildebeest are resting they are left alone. Further when looking at the first month after being put together there is a significant decline in agonistic behaviours between zebra and wildebeest (figure 3).
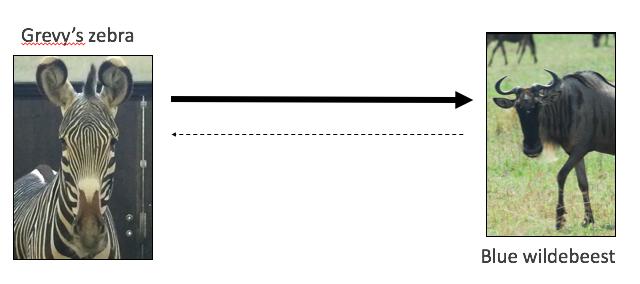
Figure 4 displays how zebra is performing most of the agonisic behaviours with 10 times a day compared to wildebeest who only performes towards zebra less than 1 time a day.
Introducing gemsbok
When introducing the gemsbok to the enclosure with zebra and wildebeest the dynamic must change between the species. The question is; will the aggressive interactions increase and if so how and between which species.
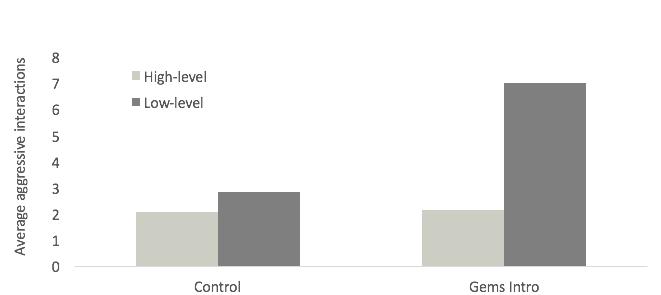
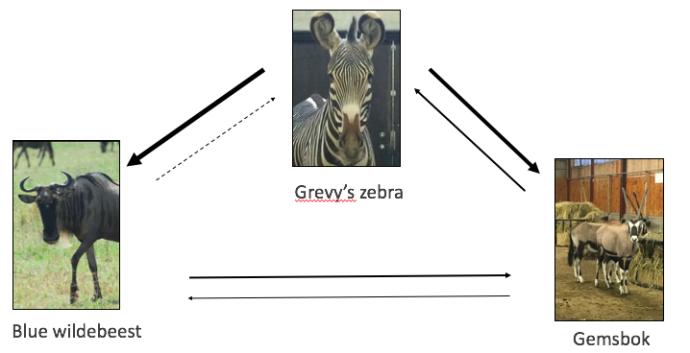
Figure 5 show a "control" which was data collected one week before introduction and "Gems intro" is data collected during one week after introduction. High level interactions did not differ. However, the low level interactions doubled. In figure 6 it is shown which species affected who and even though the gemsbok made a difference in among the animals, the grevy's zebra still seames to be the dominant. Considering earlier results where there were a decline after a month among the zebra and wildebeest this could be the case after introducing the gems as well.
Common eland, blackbuck, lechwe and chital
It was not possible due to bad camera qulity to study this stall during the first time after being introduced to each other. Therefore data from this stall was collected during the first weeks of the second month. Considering this there is a possibility there was more agonistic behaviours in the beginning compared to what the data show in figure 7. Here data show no significant differences in agonistc behaviours during time of day. However possibly a pattern of the same type as in zebra and wildebeest where there were a peek in the morning before the staff arrived and after they left in the afternoon.
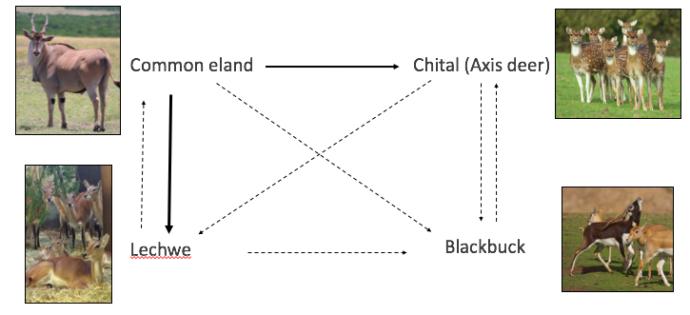
In this stall the common eland where the dominant species as shown in figure 8, most were performed from common eland towards lechwe.
Responsible for this page:
Director of undergraduate studies Biology
Last updated:
06/15/16