
Method
Study area
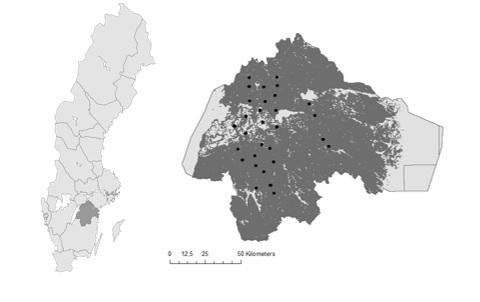
The study area is located in Östergötland. Butterfly recordings occurred in 30 hectare squares, during 3 periods by the line-transect method. Sampling areas were selected along a gradient from landscapes dominated by arable land to landscapes dominated by forest.
Butterflies
Butterflies were recorded three times on each site with the line-transect method during the summer 2015 between June and August. A total of 10 transects, 100 m each and 10 m apart in each sampling area was walked in a speed of 50 m in two minutes. Butterflies within 5 m of each side of the transect, above and in front of the surveyor were recorded. All butterfly and burnet moth individuals were recorded, and all recordings were spatially positioned using a GPS and the habitat that they were found in were noted.
Butterfly classification
The butterfly species were divided in four different groups according to their habitat preferences (Kuussaari et al. 2007, Bergman et al. 2014). Habitat specialist species often have narrow niche requirements and often require specific microclimates within a habitat, which limits their distribution (Botham et al. 2015). The groups were; grassland generalists, grassland specialists, forest edges and clearings specialists and arable field margin specialists.
Landscape and local habitat factors
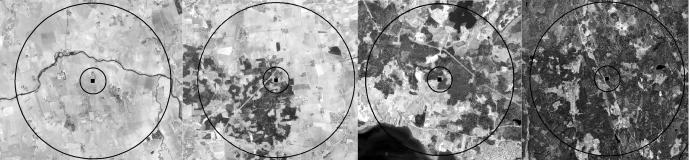
The landscape composition was calculated within two circles (radii of 500 m and 3000 m) surrounding the sampling areas. In the circles, areas of the following habitats were estimated; agricultural land, improved grasslands, semi-natural grasslands, deciduous forest, coniferous forest, mixed forest, clear-cuts, young forest, bog and bodies of water.
Within each 1-hectare sampling area the following habitats were mapped (clearings, road verges, field margins, wet forests, bogs, arable land, outcrops, openings in forest, semi-natural grasslands, non-grazed grasslands, brush woods, pine and spruce forests) by measuring the length of each habitat in each transect. The length was used to calculate the density of butterflies per 100 m in each habitat. In addition to habitat type a total of 15 local habitat factors were recorded.
Statistics
The species richness in each habitat types were estimated using EstimateSWin910 (individual-based abundance data). If two communities are compared by using only sample standardization, the richness obtained would not give a meaningful idea of the real degree of difference between the habitats richness. The degree of difference observed would depend almost entirely on the sample size used, rather than on some real characteristics of the habitats being compared. To avoid this problem an additional test was made to compare sample of equal completeness, not equal size. Completeness calculate the proportion of the total number of individuals in one habitat that belong to the species represent in the sample, and the proportion that an un-sampled species would be found if the sample would be enlarged by one individual.
Landscape effect was analyzed in SPSS with generalized linear model, negative binomial log link distribution. Each butterfly group was tested separately as the response variable and habitat length and surrounding habitat was tested as dependent variables. The tests were run for each landscape habitat and scale separately. Effect of local habitat quality was tested in the same manner, total number of individuals as response variable and local quality variables and local habitat as dependent variables, and the tests were run for each local habitat.
Confidence interval of mean density of butterflies in each habitat was calculated from a Poisson distribution.
Responsible for this page:
Director of undergraduate studies Biology
Last updated: