
Results
As a representation and summary of the observed data, MSD per time unit revealed large variation within sample location and big overlap between sample locations.
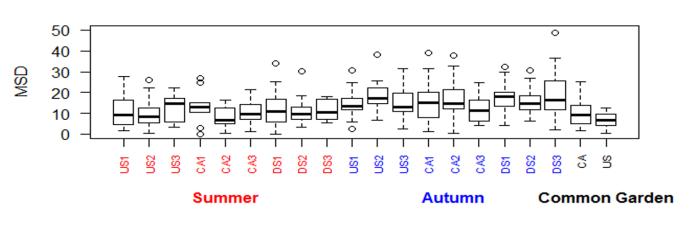
Overview of dispersion as MSD per time unit (cm2s-1). Boxplots with the median as thick horizontal line, 25th and 75th percentile as lower and upper box limits, whiskers as either the extreme ends of the data or, when outlying data points are present, 1.5 times the inter quartile range (the distance between the 25th and 75th percentile). For abbreviations of locations see Table 1 in the thesis.
There was no conclusive results in regard to differences in dispersal trait expression between the cave and surface phenotypes, neither in the common garden analysis or for the wild caught animals. However, body size had a positive correlation with dispersal and for wild caught isopods the catchment period (Summer or Autumn) influenced dispersal with isopods caught in the autumn expressing a higher dispersal expression.
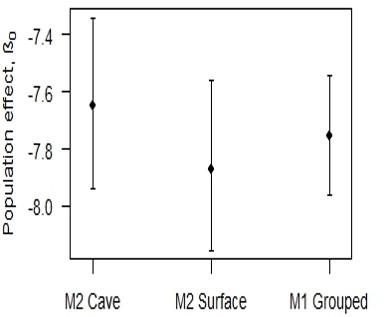
Intercept for the population effect with β0Cave, β0Surface from model 2 and β0 from model 1 in the common garden analysis. Points are the median and error bars show the 0.95 credibility interval for the posterior distribution.
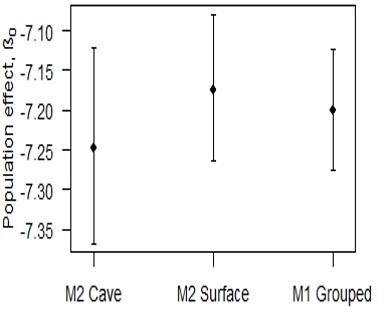
Intercept for the population effect with β0Cave, β0Surface from model 2 and β0 from model 1 in the analysis of all wild caught animals. Points are the median and error bars show the 0.95 credibility interval for the posterior distribution.
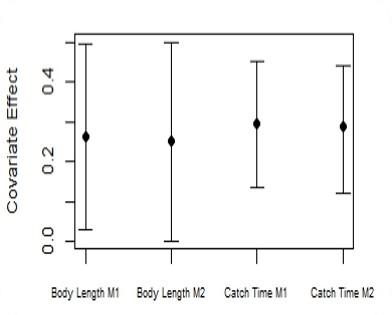
Body length and catchment period had >95 % credibility of having a positive effect on dispersal according to their respective models with best fit (M1 and M2).
Responsible for this page:
Director of undergraduate studies Biology
Last updated:
07/03/16