
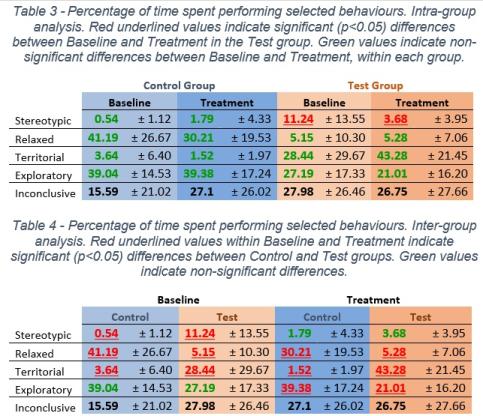
The following tables show the percentage of time lynxes spent performing selected behaviours, and the statistical significance (p<0.05) of each comparison. Both tables show the same values, but they are arranged differently to facilitate the understanding of the results. The test group showed a significant decrease in the frequency of stereotypies when exposed to CAP (Table 3). The test group displayed significantly more stereotypies than the control group during the Baseline period (Table 4).
The statistical significance of the results is also depicted in the boxplots shown in a separate tab. Note that the scales of the boxplots are not always the same. Furthermore, the line inside each box represents the mean, while the lower and upper edge mark the lower and upper quartile, respectively. The whiskers represent the standard deviation, and the open circles are the outliers.
Statistically significant (p<0.05) differences were found for
- Stereotypic behaviours between baseline and treatment period of the test group (t = 2.2919, df = 20.399, p-value = 0.03267; Figure 3);
- Stereotypic behaviours between the baseline periods of the test and control groups (t = 3.3374, df = 18.262, p-value = 0.003609; Figure 4);
- for Relaxed behaviours between baseline (t = 5.2169, df = 21.72, p-value = 3.245-5; Figure 5) periods of the test and control groups;
- for Relaxed behaviours between treatment (t = 5.9729, df = 31.914, p-value = 1.186-6; Figure 6) periods of the test and control groups;
- for Territorial behaviours between baseline (t = -3.4607, df = 19.767, p-value = 0.00250; Figure 7) periods of the test and control groups;
- for Territorial behaviours between treatment (t = 9.2988, df = 23.357, p-value = 2.566-9; Figure 8) periods of the test and control groups;
- for Exploratory behaviours between the treatment periods of the test and control groups (t = 3.8035, df = 47.978, p-value = 0.0004035; Figure 9).
Statistically non-significant differences were found between the baseline and the treatment period in the control group (Table 3) for:
- Stereotypic behaviours (t = 1.3761, df = 29.758, p-value = 0.179) (Figure 10),
- Relaxed behaviours (t = 1.4531, df = 29.036, p-value = 0.1569) (Figure 11),
- Territorial behaviours (t = 1.3266, df = 19.206, p-value = 0.2002) (Figure 12) and
- Exploratory behaviours (t = 0.058, df = 33.413, p-value = 0.9541) (Figure 13).
For the test group, non-significant differences were found between the baseline and treatment periods (Table 3) for:
- Relaxed behaviours (t = 0.0445, df = 30.464, p-value = 0.9648) (Figure 14),
- Territorial behaviours (t = 1.7873, df = 31.6, p-value = 0.08348) (Figure 15),
- Exploratory behaviours (t = 1.1656, df = 37.363, p-value = 0.2512) (Figure 16).
Finally, non-significant differences were found between the control and test groups (Table 4):
- in the baseline periods of the Exploratory behaviours (t = 1.8932, df = 33.957, p-value = 0.06687; Figure 17) and
- in the treatment periods of the Stereotypic behaviours (t = 1.5797, df = 47.995, p-value = 0.1207) (Figure 18).
Responsible for this page:
Director of undergraduate studies Biology
Last updated:
06/02/16