
Main Results
Hair Cortisol
- A significant positive correlation was found between dog and owner hair cortisol levels (Fig 1) (p =< .001).
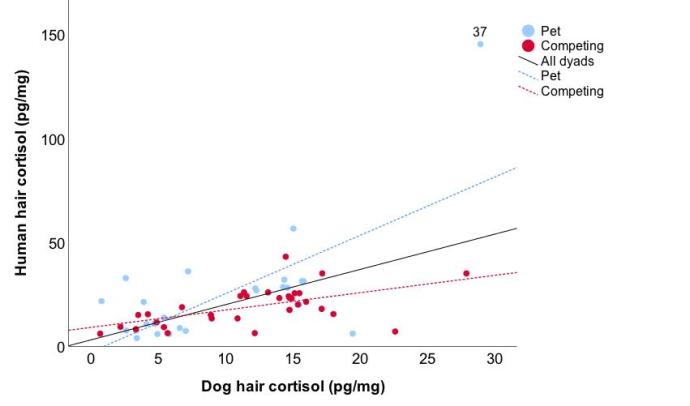
Figure 1. Correlation between dog and human hair cortisol (pg/mg). The black linear regression line represents all dog-owner dyads. Pet dyads and their lifestyle-specific linear regression line are colored light blue, while competing dyads are colored red. Outlier dyad 37 is indicated.
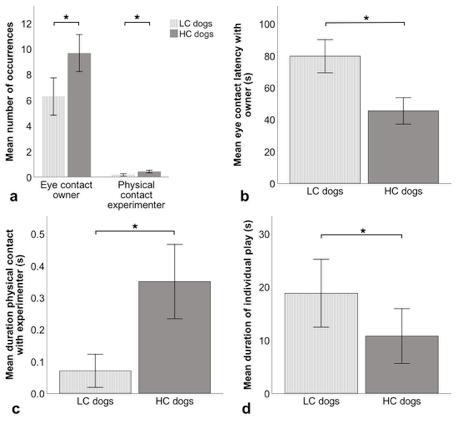
Figure 2. Differences between dogs with low (LC; ≤10 pg/mg) and high dog hair cortisol (HC; >10 pg/mg). a) Mean number of eye contact occurrences with owner and physical contact occurrences with experimenter. b) Mean eye contact latency with owner. c) Mean duration of physical contact with experimenter. d) Mean duration of individual play during a separation-reunion task. Error bars show ± 1 SE. * p ≤ .05.
Dyads were also split into two groups based on low (LC; ≤10 pg/mg) or high dog hair cortisol (HC; >10 pg/mg).
During the unsolvable-problem task:
- HC dogs had significantly higher number of eye contact occurrences (Fig 2a) (p =.034) and shorter eye contact latencies with their owner (Fig 2b) (p =.006) compared to LC dogs.
- HC dogs also had more (Fig 2a) (p =.045) and longer physical contact occurrences with the experimenter (Fig 2c) (p =.029) compared to LC dogs.
During the separation-reunion task:
- LC dogs showed significantly longer durations of individual play in comparison with HC dogs (Fig 2d) (p =.021).
- HC dogs tended to have longer durations of physical contact with their owner compared to LC dogs (p =.052).
Principle Component Analysis (PCA)
In order to reduce the number of variables, a total of nine behavioral variables from the unsolvable problem task were grouped into three principal components (PC) using a PCA: ‘Owner Proximity’, ‘Experimenter Proximity’, ‘Eye Contact’.
- Competing dogs scored significantly higher on ‘Eye Contact’ in comparison to pet dogs (Fig 3a) (p =.021).
- HC dogs scored significantly higher on ‘Eye Contact’ in comparison to LC dogs (Fig 3b) (p =.050).
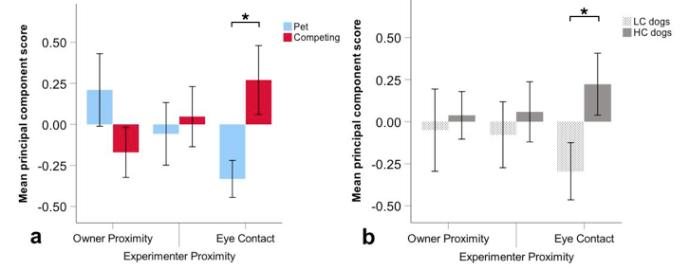
Figure 3. a) Lifestyle differences between pet and competing dogs and b) dog hair cortisol differences between low and high cortisol dogs in an unsolvable problem task. Error bars show ± 1 SE. * p ≤ .05.
Pearson correlation coefficients were calculated to determine relationships between Principle Components and other behavioral, physiological, and questionnaire variables.
- ‘Eye Contact’ correlated positively with ‘Training sessions/week’ (p =< .001)
- ‘Eye Contact’ correlated positively ‘Responsiveness to training’ (p =.046)
- ‘Eye Contact’ correlated positively Trainability’ (p =.048)
- Dog hair cortisol correlated positively with ‘Eye Contact’ (p = .009).
PetPace Activity
- Border collies had significantly higher resting percentages compared to Shetland sheepdogs (p =.010)
- Shetland sheepdogs had higher low (p =.006) and medium (p =.009) activity compared to border collies.
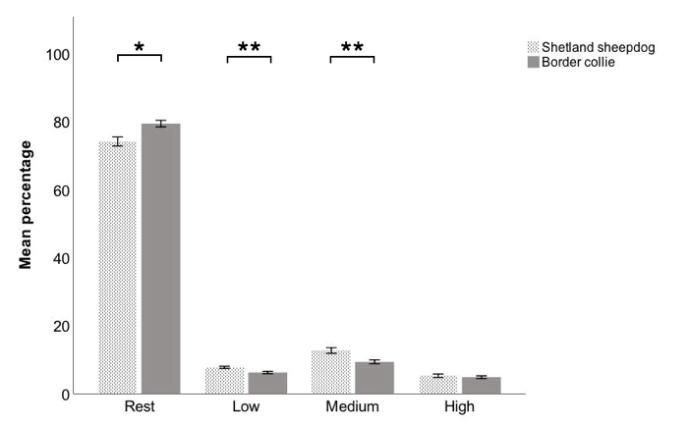
Figure 4. Differences between rest, low activity, medium activity, and high activity percentages among Shetland sheepdogs and border collies. Error bars indicate ± 1 SE. * p ≤ .05 and ** p ≤ .01.
Responsible for this page:
Director of undergraduate studies Biology
Last updated:
05/16/18