
General network metrics
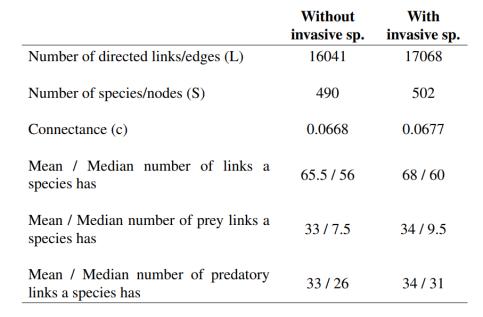
The two data sets, the one without the invasive species and the one with do not differ a lot comparing the results from the general network analyses (Table 1).
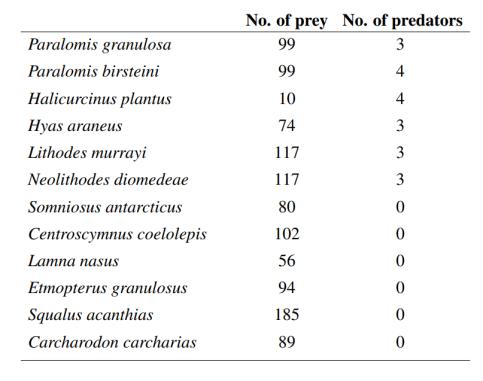
We looked at the position of the invasive species in the different trait distributions to see if they distinguished from the native species. The invasive species were found in certain areas and categories of the traits, but their traits and combination of them were not unique compared with the native species (Figure 1 to 3). Looking at the interactions, the invasive species all had large numbers of prey species and low or non-existing number of predators (Table 2). Their number of feeding interactions and prey species were for a major ity of the invasive species above the average numbers, and their number of predators were below (Table 1).
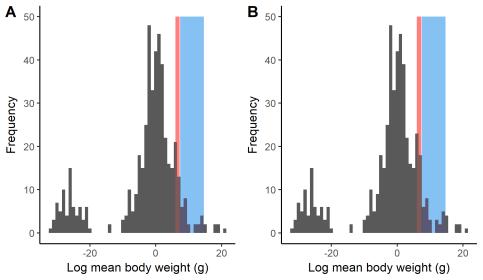
The distribution of the species logged body weight showed a high frequencies around zero and then it rapidly decreases on both sides (Figure 1). The invasive species are identified among the heavier organisms in the distribution.
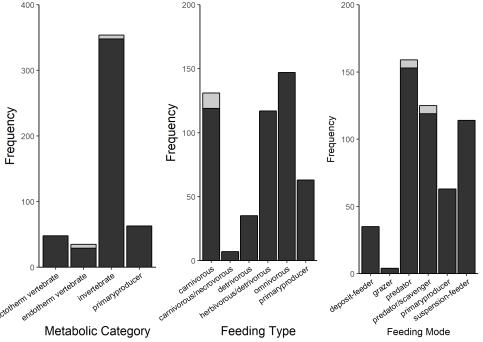
Looking at the categorical traits the invasive species were located as ectotherm vertebrates (the invasive shark species) and invertebrates (the invasive crab species) when it came to their metabolic category. All invasive species had carnivore as their feeding type, and they were identified as predators (the sharks) and predators/scavengers (the crabs) as their feeding mode (Figure 2).
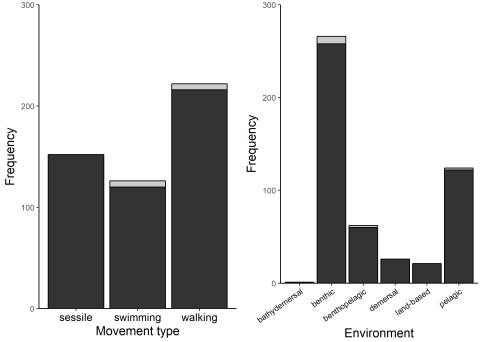
In the distribution of the different movement types the invasive species were located as swimming (the sharks) and walking (the crabs). For the feeding environment they were located to be in the benthic, benthopelagic and pelagic environment to feed (Figure 3).
Centrality metrics
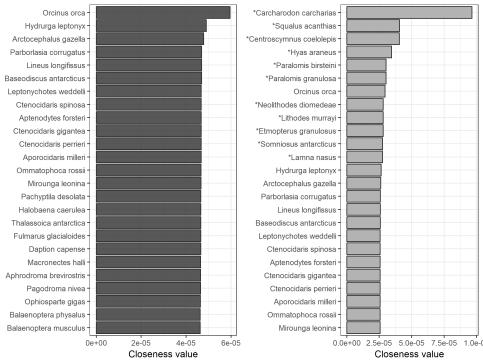
The result from the closeness analysis without adding the invasive species to the food web showed that all the species had quite similar centrality values. There were only small shifts that determined the ranking of the species, except for one specie in the top, Orcinus orca (Figure 4). Due to this small or nonexiting change in the ranking values, several species had the same rank of closeness centrality. When the invasive species were added to the food web, all except one of them ended up in the top of the ranking scale. However, the small or non-existing changes in ranking values did not change a lot when the invasive species were added, which makes it difficult to determine the actual scores of all species since several have the same values or just very small changes compared with the one above or below.
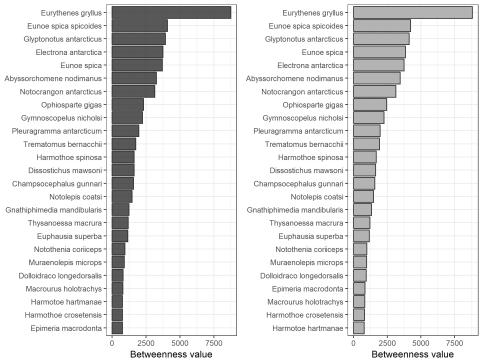
The result from the betweenness centrality did not show any significant differences between the food web including the invasive species and the one without them (Figure 5). All invasive species got a centrality value of zero and their presences didn’t change the ranking of the other species in the food web in any notable way.
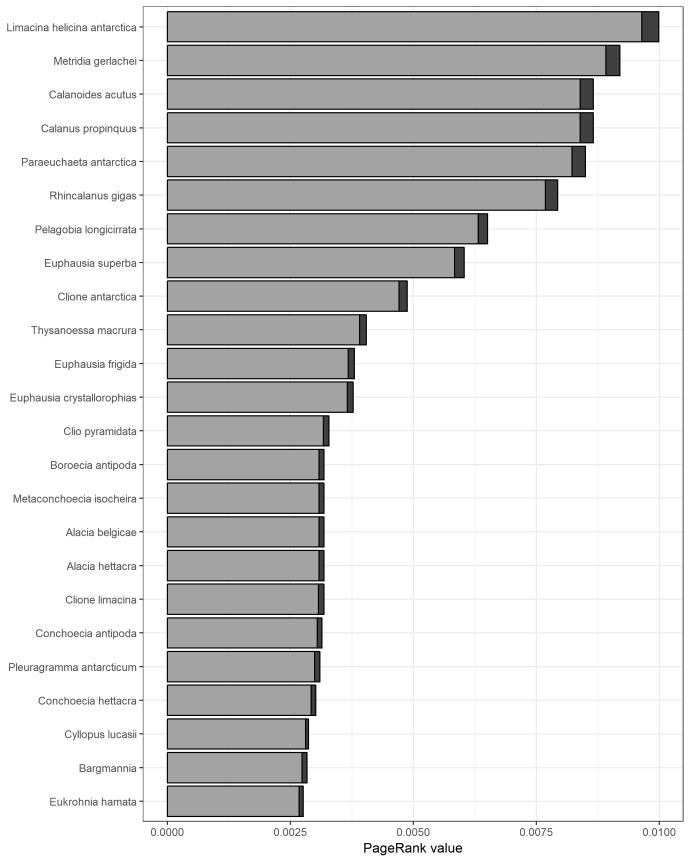
Both the PageRank analysis of the food web including the invasive species and the one without them had small differences in the PageRank values between species in the middle of the ranking, that increases toward the top and the bottom of the ranking. Comparing the two PageRank analyses from the food web with the invasive species and the one without them showed only small changes in the PageRank values. All PageRank values decreased
slightly when the invasive species were added to the food web, but the ranking order still remained almost intact. All invasive species that were added to the food web ended up among the 65 lowest ranked species, where all the shark species had the lowest PageRank values off all species.
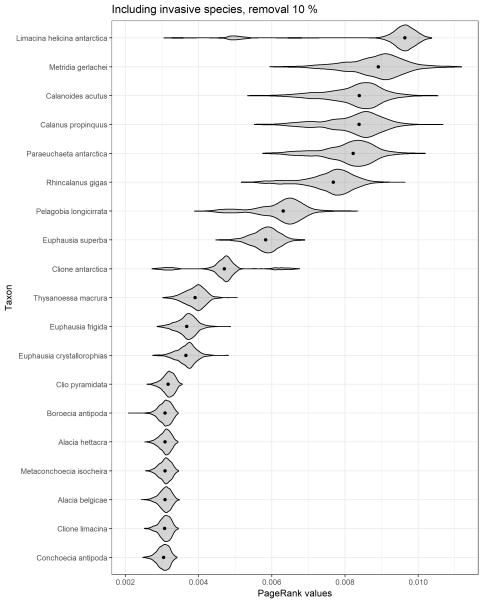
Three sensitivity analyses was performed to make sure the results from the PageRank analysis of the food web where the invasive species were included, did not depend on the estimation of the invasive species and their estimated interactions. The results showed that the result from the PageRank analysis were stable and not affected by the estimation of the new feeding interactions (Figure 7). They showed similar results of the species ranking compared with the original result where no species interaction had been randomly removed. The result from the original PageRank analysis overlap with the result from the different sensitivity analyses where the frequency were at its highest (Figure 7).
Responsible for this page:
Director of undergraduate studies Biology
Last updated:
10/18/20