
Diversity and indicator species
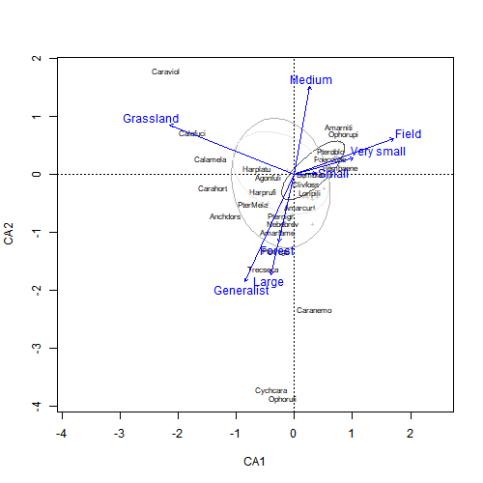
When only looking at the number of species the analysis did not show a difference between the different isolation groups. However the grassland specialist speces were more associated to the intermediate and isolated groups (Figure 1).
I also found that Poecilius cupreus was and indicator for the connected group, this species is a agricultural field species. This indicates that there is more agricultural activity surronding the connected areas, but the matrix did not show difference between groups when tested between the isolation groups.
Body morphology
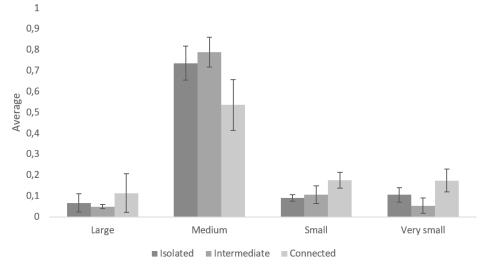
The body size distrubution was different between the isolation groups. The medium group was the largest overall but there was more size distrubution in the connected group.
There was no differnce in winglenght between the groups and the majority of carabids found had long wings.
Responsible for this page:
Director of undergraduate studies Biology
Last updated:
05/08/18