Hide menu

Results

Experiment 1

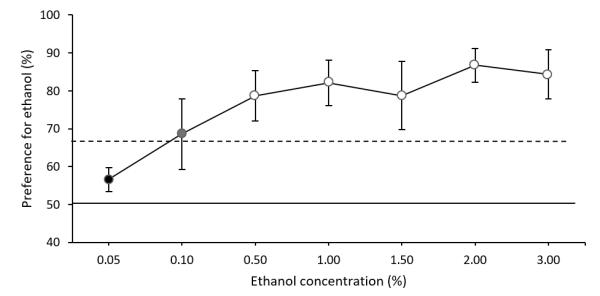
Determination of absolute taste preference and taste preference threshold for ethanol

At concentrations between 0.5% and 3.0%, the animals clearly preferred the ethanol solutions over water and met both preference criteria. With the concentration of 0.1%, the animals still showed a preference for the ethanol but only met one of the two preference criteria, and with 0.05% ethanol they failed with both preference criteria (Figure 1).

Figure 1: Taste responsiveness of six spider monkeys to various concentrations of ethanol tested against purified water as an alternative. Each symbol represents the mean value (±SD) of ten trials per animal and per concentration, for the six monkeys tested. White symbols represent concentrations for which both preference criteria (66.7% preference, and binomial test p<0.05) were met, grey symbols represent concentrations for which only of the two preference criteria was met, and black symbols represent concentrations for which none of the two preference criteria were met. The horizontal solid line represents chance level (50% preference) and the horizontal dotted line represents the first preference criterion (66.7% preference).

Experiment 2

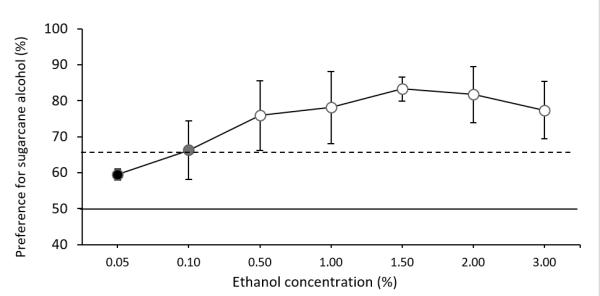
Determination of absolute taste preference and taste preference threshold for sugarcane alcohol

At concentrations between 0.5% and 3.0%, the animals clearly preferred the ethanol solutions over water and met both preference criteria. With the concentration of 0.1%, the animals still showed a preference for the ethanol but only met one of the two preference criteria, and with 0.05% ethanol they failed with both preference criteria (Figure 2).

Figure 2: Taste responsiveness of six spider monkeys to various concentrations of sugarcane alcohol tested against purified water as an alternative. Each symbol represents the mean value (±SD) of ten trials per animal and per concentration, for the six monkeys tested. White symbols represent concentrations where both preference criteria were met (66.7% preference, and binomial test p<0.05), grey symbols represent concentrations where only of the two preference criteria was met, and black symbols represent concentrations where none of the two preference criteria were met. The horizontal solid line represents chance level (50% preference) and the horizontal dotted line represents the first preference criterion (66.7% preference).

Experiment 3

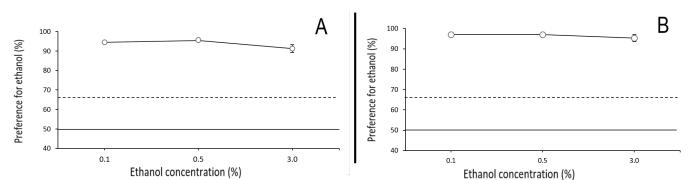
Determination of relative taste preference for ethanol

In the first two test-series, in which the ethanol-spiked and the alternative stimuli both had the same sucrose concentration, the eight spider monkeys preferred the ethanol spiked alternative with all tested concentrations (Figure 3.A & 3.B).

Figure 3: Taste responsiveness of eight spider monkeys to various concentrations of ethanol diluted in (A) a 30mM sucrose solution tested against a 30mM sucrose solution without ethanol as the alternative; (B) a 60mM sucrose solution tested against a 60mM sucrose solution without ethanol as the alternative. Each symbol represents the mean value (±SD) of ten trials per animal and per concentration, for the eight monkeys tested. White symbols represent concentrations where both preference criteria were met (66.7% preference, plus binomial test p<0.05). The horizontal solid line represents chance level (50% preference). The horizontal dotted line represents the first preference criterion (66.7% preference).


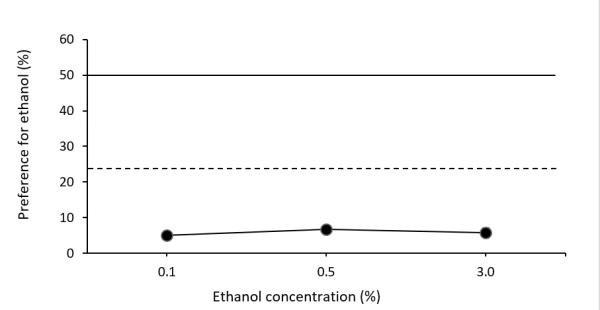
In the third test series, in which the ethanol spiked stimulus contained 30mM sucrose and the alternative stimulus contained 60mM sucrose, the eight spider monkeys clearly rejected the ethanol-sîked solutions with all tested conentrations (Figure 4)
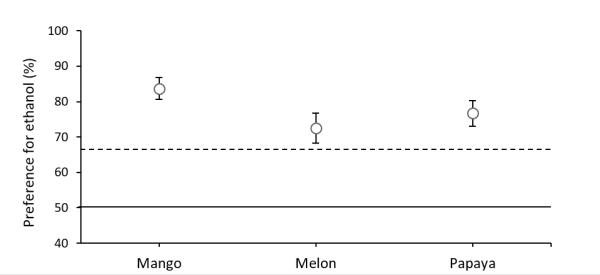
 

Figure 4: Taste responsiveness of eight spider monkeys to various concentrations of ethanol diluted in a 30mM sucrose solution tested against a 60mM sucrose solution without ethanol as the alternative. Each symbol represents the mean value (±SD) of ten trials per animal and per concentration, for the eight monkeys tested. Black symbols represent concentrations where none of the two preference criteria were met. The horizontal solid line represents chance level (50% preference) and the horizontal dotted line represents the first rejection criterion (66.7% rejection).

Experiment 4

Assessment of taste preference for ethanol in fruit matrices

With all three fruit types tested (mango, melon, and papaya), the animals as a group significantly preferred the pureed fruits spiked with 3% ethanol over the non-spiked alternative and met both preference criteria (Figure 5).

Figure 5: Taste responsiveness of eight spider monkeys to pureed fruit spiked with 3% ethanol tested against plain pureed fruit as the alternative. Each symbol represents the mean value (±SD) of ten trials per animal and per concentration, for the eight monkeys tested. White symbols represent concentrations where both preference criteria were met (66.7% preference, plus binomial test p<0.05). The horizontal solid line represents chance level (50% preference) and the horizontal dotted line represents the first preference criterion (66.7% preference).


Responsible for this page: Director of undergraduate studies Biology
Last updated: 05/07/19