
Results
Inventories
General
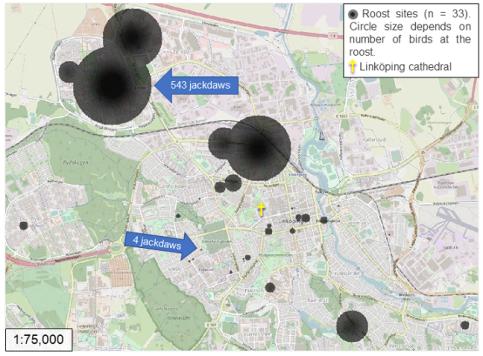
Over two inventories, I counted 2,855 jackdaws at 33 roost sites (24 roosts on buildings, 9 in trees).
To the right is a density map resulting from the two inventories. A few roosts throughout the city were very popular with hundreds of individuals; however most had but a few dozen or even just a couple of pairs.
I was able to show that the mean height of surrounding buildings within 50 m of roosts had a significant (p < 0.05) positive correlation with the number of individuals at the roost. In other words, the higher the surrounding buildings were, the more jackdaws at the roost.
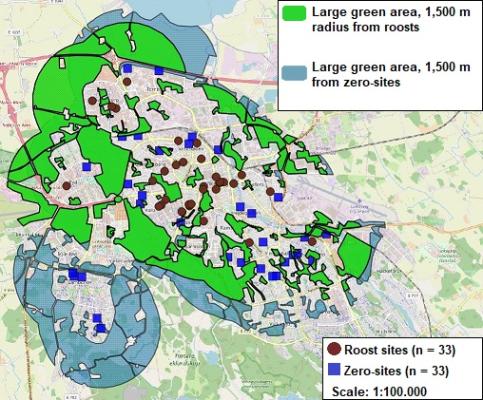
Comparisons between roosts and zero-sites
In comparing roosts and zero-sites, I found the following variables to be significant:
At roost sites,
- Higher buildings (p < 0.01)
- More complex (chimneys, nooks) roofs (p < 0.01)
- Less foraging area within 200 m (p < 0.01)
- Less large green area within 1,500 m ( p < 0.05)
Flight lines, methodology testing, seasonal differences
Flight lines data collection August — December 2018 showed that the easterly directions (NE+E+SE) were the most utilised ones, with 55.7 % of the incoming jackdaws (6,216 individuals). From the westerly ones came 27.8 % (3,095 individuals).
Methodology testing
- More than 80 % of incoming jackdaws were covered by my chosen timing for flight lines observations, i.e. less than 20 % were late arrivals.
- Regarding roost behaviour, the flux of individuals varied between the roost sites looked at, but spanned -18 — +41 % changes in number of individuals.
It should be noted that the results from the methodology testing should be taken with a grain of salt as number of samples were quite low.
Seasonal differences
For one of the measured variables a significant (p < 0.01) seasonal difference was found; temperature. It was colder during the mid-winter inventory, than the one conducted in the autumn.
Responsible for this page:
Director of undergraduate studies Biology
Last updated:
05/07/19