
Results
Management need in protected areas
The percentage of protected forests areas that according to the Swedish Forest Agency´s inventory need active management was 66 %, while 33 % of the forests were best preserved by non-intervention (Table 1). The results also showed that Nature conservation areas had a higher management need than Habitat protection areas (Table 1). For the dominating forest types, former semi-natural grasslands had the highest management need followed by deciduous forests, while the lowest management need was estimated for coniferous forests and swamps, Table 1.
Table 1. Proportion of active management and non-intervention reported by the Swedish Forest Agency in Habitat protection areas and Nature conservation areas and for dominating forest types occurring in these areas.
|
Management need according to dominating forest type
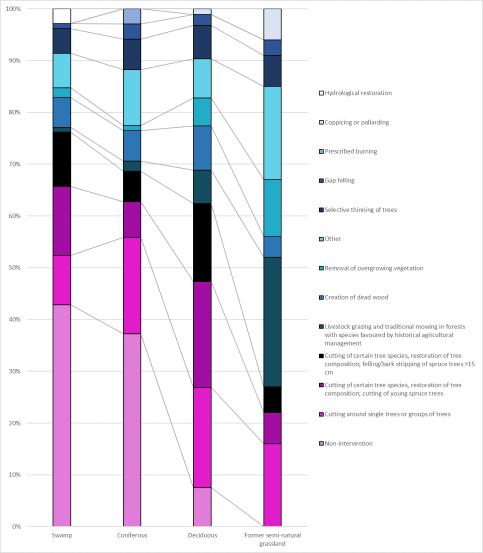
Proposed management options differed greatly depending on dominating forest type (Figure 1). Some general trends seen was that cutting, mainly of spruce was most common in deciduous forests, while in former semi-natural grasslands livestock grazing and mowing was the most common options. In coniferous forests and swamps, non-intervention was the dominating management option, followed by cutting around single trees or groups of trees and cutting of both young spruce trees and spruce trees >15 cm in diameter (Figure 1).
Management need according to tree composition
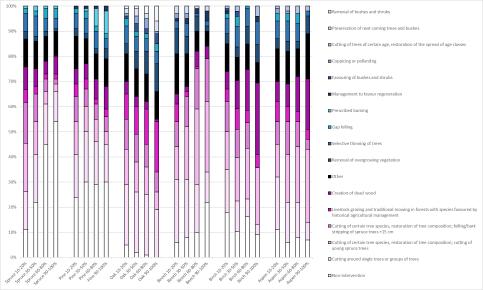
The management need differed greatly depending on tree species composition (Figure 2). Some identifiable trends were that non-intervention got more common with an increased amount of spruce in the forest stand. The same increasing trend of non-intervention was seen in beech forest where the proportion of non-intervention increased with an increased proportion of beech in the forest stand.
The oaks management need differed greatly from the previous presented, where non-intervention was only proposed in a small extent even with low proportions of oak. With high proportions of oak, no non-intervention was proposed. The amount of non-intervention in pine forest increased slightly with a larger proportion of pine in the forest stand. Birch and aspen forests had a shifting level of non-intervention, but it was generally low, and the level decreased slightly with a higher proportion of birch or aspen.
Field inventory of oak-rich environments
Occurrence of lichens (Calicium adspersum and Chaenotheca phaeocephala) were affected by several different factors. The total number of findings of each species during the inventories were low for all species except Calicium adspersum and Chaenotheca phaeocephala (Table 2). Occurence of both species were positively affected by bark fissure depth. Canopy cover (total and bushes & young trees(<10cm)) had a negative effect on occurrence of Chaenotheca phaeocephala, while openness had a positive effect (Table 3). No variables had a significant effect on the abundance of lichens.
Table 2. Number of trees that there were findings of each lichen species on, during performed inventory. In total 148 oaks were visited.
|
Table 3. GLM results for Calicium adspersum and Chaenotheca phaeocephala, testing variables’ effect on occurrence, presenting estimate, standard error and p-value
|
Explanatory variable |
Calcium adspersum
Estimate(SE) P-value |
Chaenotheca phaeocephala
Estimate (SE) P-value |
||
|
Bark fissure depth |
0.685 (0.250) |
0.006 * |
0.601(0.238) |
0.011 * |
|
Vitality |
0.00840 (0.00718) |
0.242 |
0.000735 (0.00411) |
0.858 |
|
Overgrowth |
-0.0127 (0.0180) |
0.481 |
-0.0405 (0.0189) |
0.032 * |
|
Canopy cover total |
-0.00553 (0.0185) |
0.765 |
-0.0351 (0.0169) |
0.038 * |
|
Canopy cover bushes & young trees (<10cm) |
0.00554 (0.0102) |
0.587 |
-0.0191 (0.00909) |
0.036 * |
|
Canopy cover coniferous |
0.000209 (0.0140) |
0.988 |
-0.00133 (0.0133) |
0.921 |
|
Canopy cover deciduous |
0.00780 (0.0106) |
0.463 |
-0.000403 (0.00934) |
0.967 |
Responsible for this page:
Director of undergraduate studies Biology
Last updated:
05/15/19