
1. Video recorded data
A feeding event can be split in 2 periods:
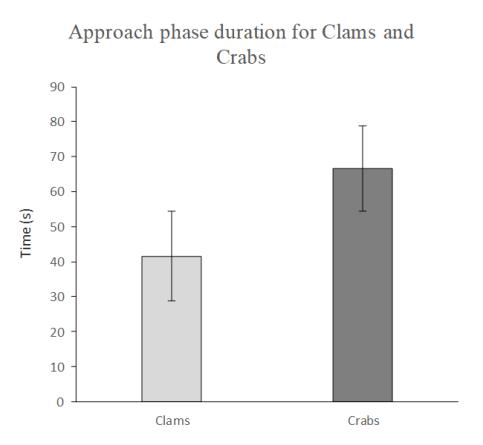
- The approach phase: Defined from the moment a turtle starts swimming towards the food, to the first successful bite
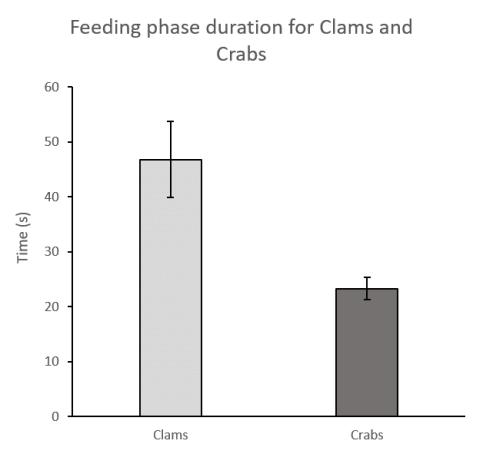
- The feeding phase: Defined as starting from the first successful bite to the moment the turtle would swim away and jaw movements stopped
The idea here was simply to compare these two phases when the turtles were eating a clam and when they were eating a crab.
From the first figure, we can see a significant difference in the approach phase duration.
Concerning the feeding phase, on average, a turtle would spend 104% more time to eat a clam than to eat a crab.
2. Energy expenditure and intake
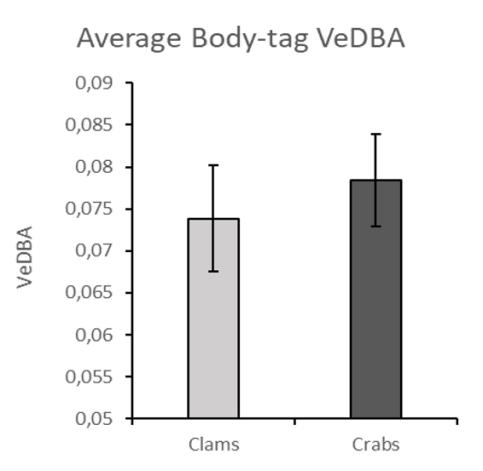
The data logger were used to measure the energy expenditure of a turtle based on the vectorial body dynamic acceleration (VeDBA). Vedba, to remain simple, is based on the idea that the energy expended over a time period is equivalent to the mechanical work done
What we can see here is that,on average, a turtle would spend the same amount of energy during a feeding event (approach phase + feeding phase) when eating a clam or when eating a crab.
However, when compared, one crab brings on average 2.214 kcal to the turtle, when a clam only brings 1.352 kcal. So based on the "feeding phase" duration, for a clam, 1352 calories took 47s to consume, resulting in a calorie intake rate of 29 calories per second versus 96 calories per second for a crab.
Responsible for this page:
Director of undergraduate studies Biology
Last updated:
05/22/19