
Results
Consistency of behavioural measures
Crickets showed consistency over time in all the obtained behavioural measures (i.e. these all describe variation in animal personality). The two successive measures of activity in a novel environment were positively correlated (N = 26, Rs = 0.43, p = 0.032), as were the two successive measures of activity in familiar environment (N = 32, Rs = 0.42, p = 0.014), and the two successive measures of boldness (N = 30, Rs = 0.61, p = 0.0004).
Correlations among behavioural variables
Exploration and activity were negatively correlated (N = 76, Rs = -0.48, p < 0.0001), likely due to the fact that the activity score was used in deriving the exploration score. Exploration and boldness were not significantly correlated (N = 76, Rs = 0.12, p = 0.30), nor were boldness and activity (N = 76, Rs = -0.13, p = 0.28).
Sex differences
Males (N = 38) were, overall, less explorative than females (N = 38) (W = 964.50, p = 0.012), while males and females did not differ in activity (W = 693.00, p = 0.77), or boldness (W = 867.50, p = 0.13). Male and female data was pooled for all the analysis above, due to similar trends in both sexes, but was not pooled for the analysis on the effect of personality to successive threatening stimuli, as different trends between sexes were detected.
Effect of personality on response to successive threatening stimuli
Males
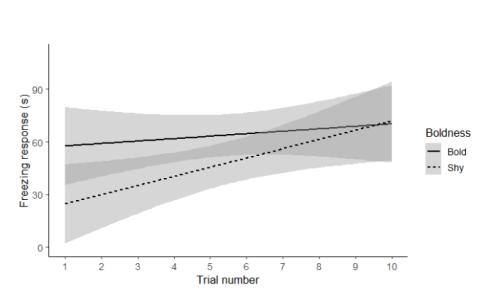
The interactions between trial number and exploration or activity did not affect the freezing response of males (trial x exploration, F = 2.05, Z = 1.70, p = 0.093; trial x activity F = 1.16, Z = 1.10, p = 0.28). On the other hand, the interaction between trial number and boldness explained variation in the response of male crickets to the repeated threats such that shyer males were more likely to become sensitised than bolder males (F = 4.40, Z = 2.10, p = 0.035, Fig. 1).
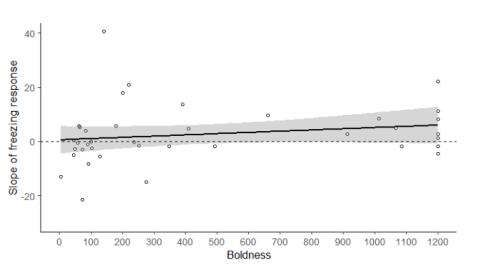
In males, there was a positive correlation between boldness and the slope of their freezing behaviour over the 10 threatening stimuli (N = 38, Rs = 0.34, p = 0.04, Fig. 2). There was no significant correlation between the slope of freezing over the 10 threatening stimuli, and activity (N = 38, Rs = 0.13, p = 0.44) or exploration (N = 38, Rs = 0.08, p = 0.63).
Females
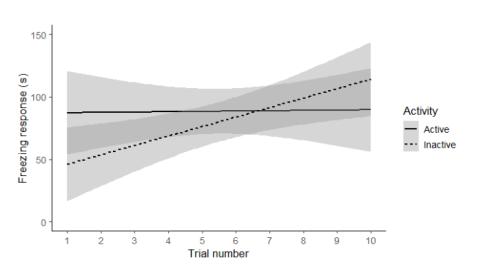
Trial alone had a significant effect on the freezing response of female crickets (F = 20.43, Z = 4.51, p < 0.01). The effects of exploration and boldness, or interactions between trial and exploration, or trial and boldness, were not significant (trial x exploration: F = 0.77, Z = -0.89, p = 0.38; trial x boldness: F < 0.01, Z = -0.39, p = 0.71). However, the interaction between trial and activity tended to explain the freezing response, such that less active females were more likely to become sensitised than more active females (F = 2.84, Z= -1.86, p = 0.07, Fig. 3).
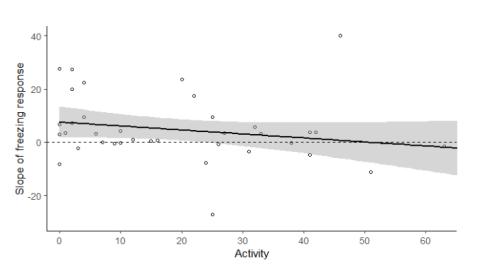
In females, there was no significant correlation between the slope of freezing over the 10 threatening stimuli, and exploration (N = 38, Rs = 0.080, p = 0.64) or boldness (N = 38, Rs = 0.0041, p = 0.98). However, there was a trend towards a negative correlation between female activity and the slope of freezing response (Rs =-0.30, p = 0.06, Fig 4.), such that more active females were more likely to habituate than less active females.
Responsible for this page:
Director of undergraduate studies Biology
Last updated:
05/27/20