
Results
Effect of the type of the enclosure on chimpanzees’ social interactions
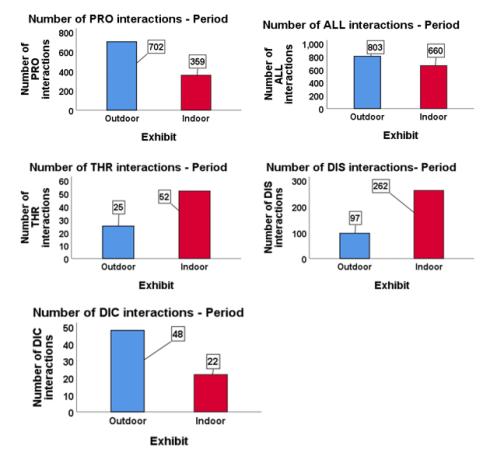
The One Sample Chi-square test indicated that there was a statistically significant difference of the number of proximity, allogrooming, displace, threat and display interactions between the outdoor and indoor exhibit. More specifically, we found that the number of proximity interactions was higher in the outdoor compared to the indoor exhibit (χ2(1) = 110.89, p = 0.000). Also, the number of allogrooming interactions (χ2(1) = 13.98, p = 0.000) and the number of displace interactions (χ2(1) = 9.66, p = 0.002) were higher in the outdoor enclosure compared to the indoor one. On the other hand, we found that the number of threat (χ2(1) = 9.47, p = 0.002) and display (χ2(1) = 75.84, p = 0.000) interactions were higher when the chimpanzees were indoors compared to outdoors.
Effect of the presence of enrichment on the chimpanzees’ social interactions
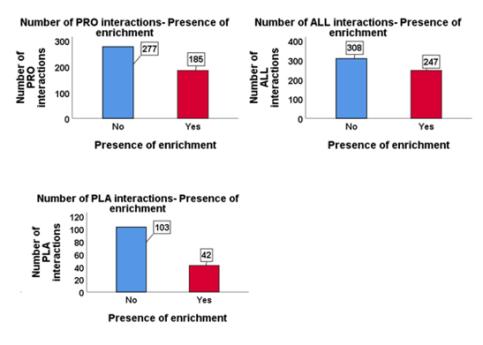
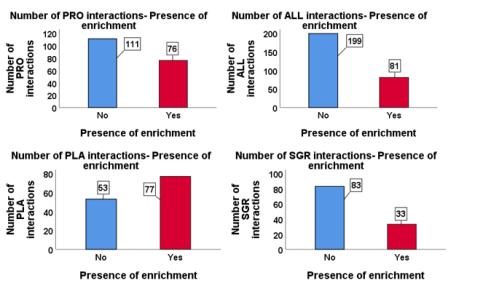
The One Sample Chi-square test indicated that there was a statistically significant difference in the number of proximity interactions between the enrichment days and the no-enrichment days in both the outdoor (χ2(1) = 18.32, p = 0.000) and indoor exhibit (χ2(1) = 6.55, p = 0.001). In particular, the number of proximity interactions was higher when enrichment was absent than when enrichment was present in both environments. Furthermore, the number of allogrooming interactions was higher when enrichment was absent compared to when enrichment was present in both the outdoor (χ2(1) = 6.71, p = 0.010) and indoor exhibit (χ2(1) = 49.73, p = 0.000). In the outdoor exhibit, the number of play interactions was higher when enrichment was absent compared to when the enrichment was present (χ2(1) = 25.66, p = 0.000), but in the indoor enclosure the number of play interactions was higher when the enrichment was present compared to when the enrichment was absent (χ2(1) = 4.43, p = 0.035). In the indoor exhibit, the number of simultaneous grooming interactions was higher when the enrichment was absent compared to when the enrichment was present (χ2(1) = 21.55, p = 0.000).
Effect of the type of enrichment on chimpanzees’ social interactions
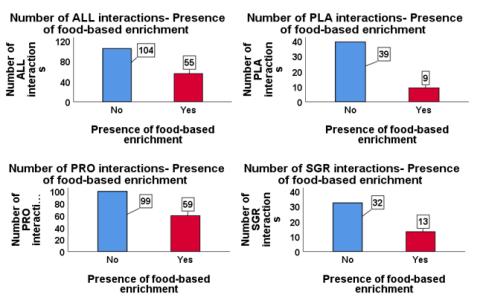
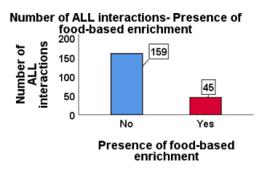
The One Sample Chi-square test indicated that the number of proximity interactions was significantly higher on the days without enrichment compared to the food-based enrichment days in the outdoor exhibit (χ2(1) = 10.13, p = 0.001). Furthermore, the One Sample Chi-square test indicated that the number of allogrooming interactions was significantly higher on the days without enrichment compared to the food-based enrichment days in both outdoor (χ2(1) = 15.1, p = 0.000) and indoor exhibit (χ2(1) = 63.71, p = 0.000). In the outdoor exhibit, the number of play interactions was significantly higher on the days without enrichment compared to the days with food-based enrichment (χ2(1) = 18.75, p = 0.000). Finally, in the outdoor exhibit the number of simultaneous grooming interactions was significantly higher on the no-enrichment days compared to the food-based enrichment ones (χ2(1) = 8.02, p = 0.005).
Social Dynamics in the chimpanzees’ group
A. Dyadic indexes
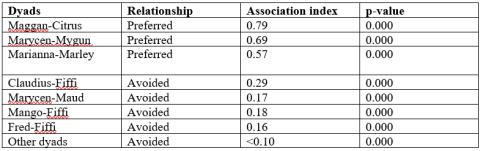
Across all chimpanzee dyads, associative indexes averaged 0.29 ± 0.28 (SD) ranging between 0.00 (most dyads) and 0.79 (Maggan-Citrus). Across all chimpanzee dyads, allogrooming interaction rates averaged 30.00 ± 32.84 (SD) ranging between 0.00 (most dyads) and 158.00 (Mango-Fiffi) and agonistic interaction rates averaged 3.80 ± 2.48 (SD) ranging between 0.00 (most dyads) and 7.00 (Mika-Mona). Within the allogrooming network, Fiffi was the recipient with the highest interaction rates, with a maximum interaction rate 158.00 (Mango to Fiffi), but also other high interaction rates (38.00: Claudius to Fiffi, 38.00: Fred to Fiffi). Within the agonistic network, Claudius was the most frequent actor in aggressive interactions, but never recipient.
B. Preferred and avoided relationships
The test for preferred and avoided relationships from the associative data (proximity) was significant (p=0.000); therefore, the null hypothesis was rejected. This test identified three dyads with significantly preferred relationships and the rest of the relationships were significantly avoided.
C. Test for reciprocity or unidirectionality
The test for reciprocity for the allogrooming network found no significant absolute reciprocity, but significant relative one (Mantel Z-test, p = 0.065; Kr-test, p = 0.01). This shows that the chimpanzees in this group returned allogrooming interactions to another individual based upon the frequency of interactions that they received from that other individual, relative to the rates at which they receive interactions from other members of the population. Furthermore, the test found no significant absolute reciprocity, but a significant relative one for the agonistic network (Mantel Z-test, p = 0.193; Kr-test, p = 0.015). This means that individuals returned agonistic interactions to another individual based upon the frequency of interactions that they received from that other individual, relative to the rates at which they received interactions from other members of the group.
D. Dominance hierarchy
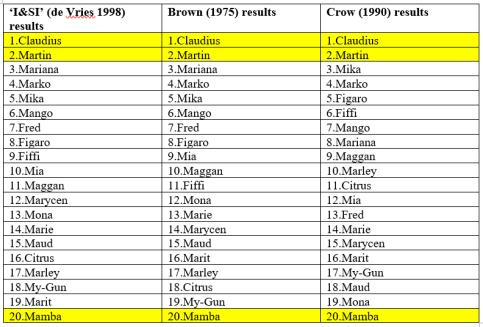
We calculated the dominance rank for each individual using three different methods. Claudius was consistently ranked as the most dominant and Martin as the second most dominant, whereas Mamba was consistently ranked as the least dominant. All the other individuals were ranked in different positions across the three different ranking methods.
Responsible for this page:
Director of undergraduate studies Biology
Last updated:
05/25/20