
Data analysis
Pre-processing of data
The ECG (from both baseline and stimuli presentation) was calculated into RR intervals in the software TeleVet 100 version 5.1 beta.
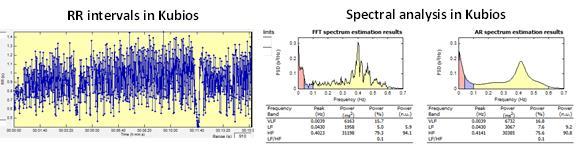
The RR intervals were first re-calculated into HR (thought to be representative of both SNS and PNS). After this, the RR intervals were imported into the software Kubios HRV Analysis for a spectral analysis.
From the spectral analysis, three HRV parameters were extracted.
- RMSSD (thought to be representative of PNS).
- HF power (thought to be representative of PNS).
- LF/HF ratio (thought to be representative of SNS).
Statistical analysis
The HR data (both baseline and stimuli presentation) were analysed with a General Linear Model (GLM).
The HRV data (both baseline and stimuli presentation) were analysed with the GENMOD procedure.
The level of significance was set at P<0.05.
Responsible for this page:
Director of undergraduate studies Biology
Last updated:
05/04/13