
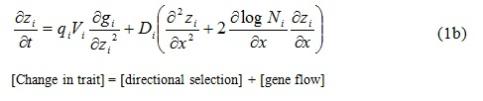
Main equations
The eco-evolutionary model dervied from a previous model, developed by Norberg and colleagues in 2012. This model was published in Nature Climate Change (doi:10.1038/nclimate1588) and proposes the baseline for my framework. Here, I will show you the two main equations used in the model, that is, change in population size N (eq. 1a) and change in the evolving trait z (eq. 1b) in space x and time t.
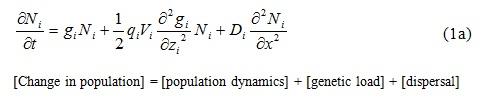
Ecological interactions in the communities followed a slightly modified Rosenzweig-MacArthur model, encoded in the fitness function g (eq. 1a). Herbivores were assumed to exhibit a type II functional response. Parameter values were inferred from body masses of species using allometric relationships. In my model, plants had larger bodymasses than herbivores, exemplifying the relationship between flowering plants and insects.
Climate simulations
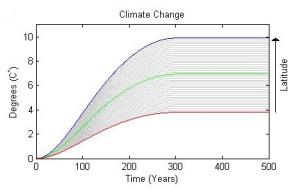
The latest predictions of future warming, made by IPCC (2013), were used for the climate simulations in this study. The magnitude of the warming is predicted to differ dependent on location, with the northern hemisphere experiencing the highest level of warming. In this study, the temperature increase after 300 years of warming ranged from three degrees Celsius in the tropical areas to ten degrees Celsius in the polar region. This is shown in the figure; the absolute change in temperature over time in different locations is described by the grey series. Three locations are highlighted; polar in blue, temperate in green and tropical in red.
Responsible for this page:
Director of undergraduate studies Biology
Last updated:
06/02/14