
Phosphorus Fractionation-BAP
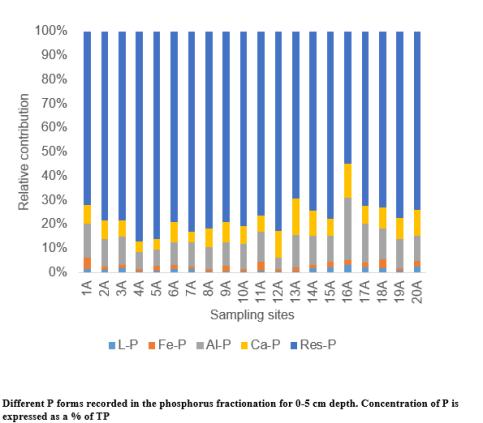
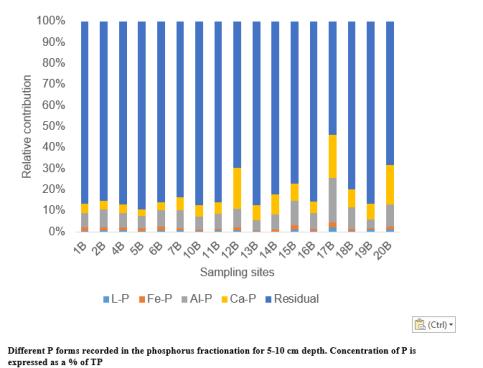
Five main P forms were recorded from the fractionation scheme, these are, Loosely-P, Fe-P, Al-P, Ca-P and Residual-P. The scheme showed majority of the P in sediment being in the form of Residual-P in both depths studied (Figs 1 and 2). Amongst the inorganic P forms, majority of P was observed to be binding to Al in both depths as well (Figs1 and 2). It was also observed that all P forms were higher in the 0-5 cm depth (Fig 1 and 2).
Spatial Distribution of P
The pattern and spatial distribution of P was observed to vary along the latitude transects and as well as depth. Samples within the 0-5 cm was significantly higher in P concentration as compared to those in 5-10 cm. A paired T-Test showed significance in all inorganic P forms as well as TP (Loosely-P, Fe-P, Al-P, Ca-P and TP had p values of 0.0001,0.0036, 5.9 x10 -5 , 0.00054 and 0.006 respectively).
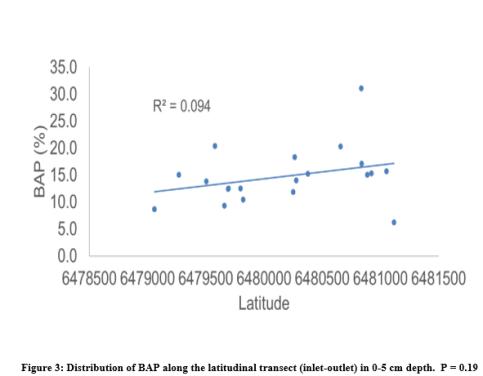
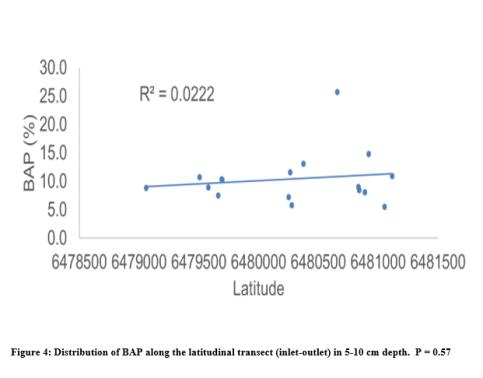
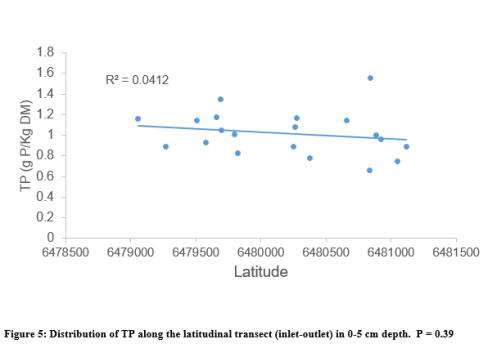
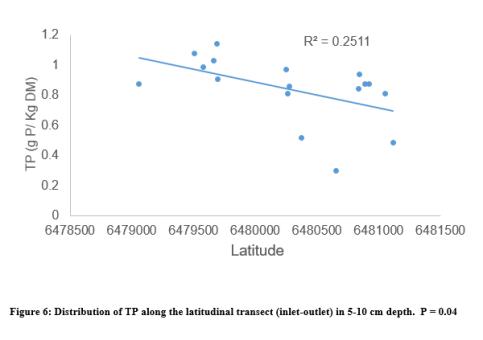
BAP also varried with depth but not on the latitudinal transect (inlet-outlet), (Figs 3 and 4). TP on the other hand varried in depth and also the latitudinal transect (Figs 5 and 6)
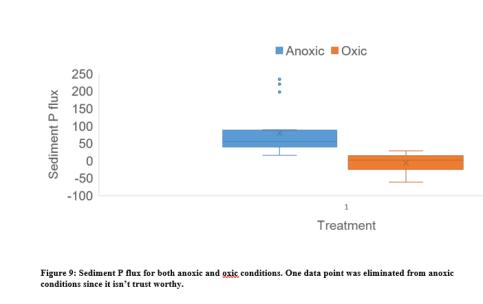
Sediment P Release and Flux
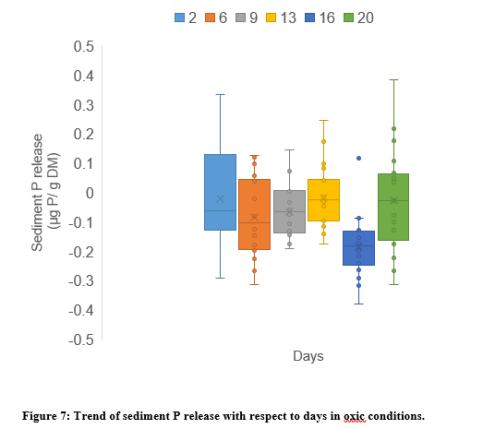
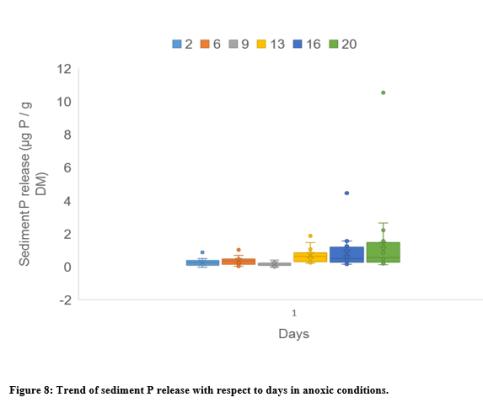
For incubation under oxic conditions, the sediment P release had an average of – 0.07 µg P/g and ranged between -0.31 – 0.39 µg P/g (Fig7). The sediment P flux on the other hand had an average of -6.43 µgd-1m-2 and ranged between -61.36 µgd-1m-2 - 28.11 µgd-1m-2 (Fig 9). In anoxic treatment, an average of 0.60 µg P/ g was recorded for the sediment P release setup. The values recorded ranged between 0 – 10.5 µg P/g (Fig 8). Sediment P flux in anoxic treatment had an average of 120.17 µgd-1m-2 and ranged between 15.45 µgd-1m-2 - 898.89 µgd-1m-2 (Fig 9).
The trend observed in the oxic sediment P release was a fluctuating one. There was generally no net release on each of the days. However, some individual sites recorded a release of sediment P. Day 16 had the least release value though one site showing a significant release. Whiles Day 20 data also showed the least of P sorption.
The sediment P released in anoxic condition, showed an increase from day 2 to day 6 but dipped in day 3. The increase occurred in day 13 and levelled off in days 16 and 20. However some individual sites in days 16 and 20 recorded a high sediment P release out of range, that is 4.44 and 10.53 µg P/g DM respectively (Fig 8).
The difference in sediment P flux under both treatment conditions was significant (P = 0.007).
Responsible for this page:
Director of undergraduate studies Biology
Last updated:
06/16/16