
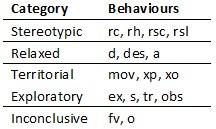
Data were stored in Microsoft Excel® 2013 spreadsheets. Behaviours were grouped into categories, according to Table 3. Observed behaviours that were not part of this study’s ethogram (Table 1), were recorded as “o” (other) and grouped in the Inconclusive behaviours category. These behaviours were not statistically analysed, since they were considered not to be relevant for this study, given its aim. The percentage of time each animal performed each behaviour was calculated, and each animal’s activity budget was depicted in a histogram, for the data recorded with the focal sampling method. The percentage of events performing each behaviour within a category was calculated for the data recorded with the instantaneous scan sampling. The data collected with the first recording method did not meet the parametric criteria, as they were not normally distributed and showed unequal variances. For that reason, the unequal variance t-test (or Welch t’-test) was used. To analyse the data collected with the second recording method, Generalized Linear Models (GzLM) were used. All statistical analysis was carried out using the statistical package R 3.2.4 (R Core Team, 2014).
Responsible for this page:
Director of undergraduate studies Biology
Last updated:
06/02/16