
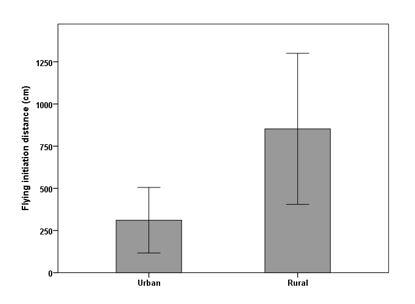
Boldness
Neophobia
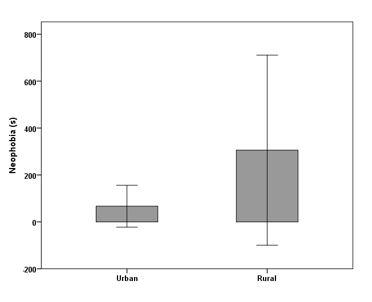
All the birds tested in neophobia approached the object. The birds trapped in the urban area approached the novel object faster than the ones trapped in the rural area (t18 = -3.64; p = 0.002). The rural individuals again show a higher variation in the latencies to approach the novel object than their urban conspecifics.
Problem solving abilities
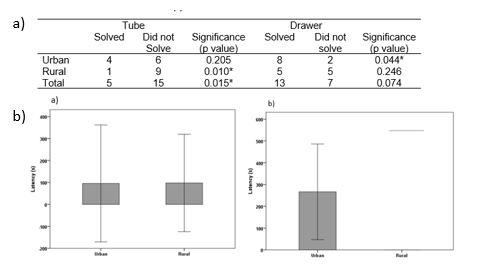
The results show with a 95% probability that there was a higher number of the birds trapped in the rural areas that did not solve the tube task (9/10) compared to the ones that did solved it (1/10) (p=0.010). The results also show that a higher number of the birds trapped in the urban areas solved the drawer task (2/10) compared to non-solvers (8/10) (p=0.044). In Addition, it was possible to observe that a higher number of birds, both rural and urban, did not solved the tube task (15/20) compared to the ones who solved it (5/20) (p=0.015). Even if there were no statistical significant differences, a higher number of the birds trapped in the urban areas solved both the tube and the drawer task compared to the number of birds trapped in the rural areas. There were no differences between urban and rural individuals in the latency to solve the drawer task. However, the urban individuals which solved the tube task took shorter time to do it than the unique rural individual who solved it (t3 = -5,07; p=0.015).
Responsible for this page:
Director of undergraduate studies Biology
Last updated:
05/15/17