
Tigers in Cambodia
Tiger (Phantera tigris) is endangered according to the IUCN Red lists (Goodrich et al, 2015), mostly because of poaching, habitat loss and prey depletion (Linkie et al, 2003; Lynam et al, 2006; Lynam, 2010). Compared to records from the early 1900 it is appreciated that tiger holds approximately 7-13 % of its historical range today (Walston et al, 2010; Driscoll et al, 2012; Ripple et al, 2014). According to the latest census, the wild global tiger population is 3890 (Global tiger forum hosted by WWF in April 2016).
Tiger population in Cambodia have historically been high, but decreased rapidly over the last 50 years. This is much due to poaching, as there is a great market of tiger parts (Walston et al. 2001). In early 1990’s, it was estimated that 100 to 200 tigers a year were exported on wildlife markets (MOE, 2006). The poached tigers in Cambodia that has been recorded have decreased; from 85 poached tigers in 1998, 40 in 2001 to 0 poached tigers in 2004 (Weiler et al, 2006). This might be due to the exceptionally high hunting pressure leading to a crash in the population (Weiler et al, 2006; Lynam 2010), but also from habitat loss. The primary forest have decreased, from covering more than 70 % in 1970 to 3.1 % in 2013 (Tomppo et al, 2010). The low prey densities have also been pointed out as a limiting factor for the tigers, accelerating their declines (Karanth & Stith 1999).
Today, the tiger population in Cambodia might still exists, but if so, the population is very low and scattered and therefore tigers are considered functionally extinct in Cambodia (Launay et al, 2012; Lynam, 2010; Driscoll et al, 2012).
Study site
Cambodia is part of a global biodiversity hotspot, with an estimate of 3500-7000 endemic plants and 178-528 endemic vertebrates (Brooks et al; 2002; Mittermeier et al, 1998; Myers et al, 2000). The study site for in this study is the Sen Monorom, the capital of Mondulkiri province in the eastern Cambodia (Figure 1). The province is 14 288 km2 and has a low human population, with 60 811 inhabitants, with large groups of indigenous Bunong people. Mondulkiri is part of the Eastern Plains Landscape, EPL. The EPL covers 800 000 hectares (30 000 km2), with more than 10 000 km2 of dry forest making up one of the largest semi evergreen forest in South East Asia (Gray et al, 2012; Lynam, 2010; O’Kelly et al, 2012). The landscape consists of lowlands (generally under 150 m asl) with deciduous dipterocarp forests as well as open grasslands. The fire frequency is high, and there is patches of mixed deciduous forests, wetlands and a big network of rivers running across the EPL (Ahrestani & Sankaran, 2016).
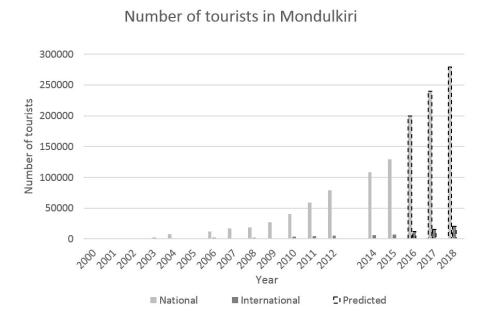
EPL has five protected areas, namely Lomhat wildlife sanctuary, Mondulkiri protected forests, Phnom Prich wildlife sanctuary, Seima protected forests and Yok Don (Launay et al, 2012). Together, the protected area covers an area of almost 14 000 km2, making up almost four fifths of the landscape (Ahrestani & Sankaran, 2016; Launay et al, 2012). This area was once described as “great game-lands of the world; a Serengeti of Asia” (Gray et al, 2012). Together with the political instability, many species of mammals, such as tiger, leopard, Asian elephant, wild cattle and Eld’s deer and hog deer declined in their population. EPL was also home to the now globally extincted kouprey (Bos sauveli), that is now functioning as a symbol for Sen Monorom (Ahrestani & Sankaran, 2016). Here is also 50-60 % of the global population of the endangered banteng (Bos javanicus) (Gray et al, 2012).
Mondulkiri protected area in EPL is the last location where tigers were caught on a camera trap in 2007 (WWF, 2016). Part of Mondulkiri is highlighted as level-one tiger conservation landscape, and is one of 12 tiger conservation recovery landscapes (Gray et al, 2012). EPL have been assigned Global Priority status for the tiger conservation (Sanderson et al, 2010), and CTAP (2012) similarly cites EPL as the best location to re-introduce tigers.
Tourism in Eastern Plains Landscape
Tourism is one of the biggest industries in the world (Scheyvens, 2015) and generated 7.2 trillion US dollar (9.8 % of the global GDP) and 285 million jobs (1 out of 11 jobs in the global economy) in 2015 (World Travel & Tourism Council, 2016).
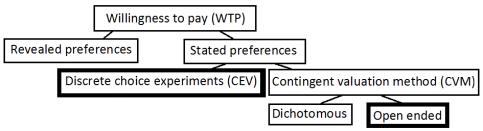
In Cambodia, tourism contributes as the second largest industry, after the garment industry. In 2006, tourism generated 16 % of the GDP in Cambodia, and in 2009 there were more than 2 million international visitors (Reimer & Walter, 2006). Ecotourism is the fastest growing sector, with an estimated growth rate of 10-15% (Scheyvens, 2015). Mondulkiri is famous for its ecotourism, which is highlighted in the guidebooks, such as lonely planet, and is considered to different rankings as the “top-ten” activities to attend to while in Cambodia (Ray & Lee, 2016). There is an annual increase of both international and national tourists visiting Mondulkiri (Mondulkiri Provincial Department of Tourism, 2016) (Figure 2).
The tourism includes accommodation, travels and food, which can contribute to the local economy (Walpole & Leader-Williams, 2002). According to a report by Mondulkiri Provincial Department of Tourism 2013, international tourists stays on average 3 nights and 4 days, and spends on average $30-50 per day. The national tourists on the other hand, stays on average 2 nights and 3 days, and spend on average $16-20 per day.
The ecotourism in Mondulkiri is centered on the elephants, and attracts people whom are environmental aware and concerned about conservation and animal welfare. Here, tourists get to see elephants and contribute to local economy, education and conservation through ecotourism. The elephants are domestic, typically working elephants that has suffered from years of heavy work in the logging or tourist industry. Using the elephants through ecotourism, an alternative income is generated, as well as illegal and unethical activities are avoided. Although, breeding elephants is a cultural taboo in Cambodia (Maltby & Bourchier, 2011) and since the 1990’s elephants are not allowed to be caught in the wild. This makes it likely that the elephants in Mondulkiri will be the last generation of domestic elephants. Therefore, it is likely that the ecotourism will have a great potential as the demand increases but the supply (e.g. the elephant tourism) decreases as the domestic elephant’s age and eventually dies out. The approximate volume of business during 2015 for one tour operator that offered ethical elephant tours was $ 400 000, and a total of 129 712 international tourists visited Mondulkiri in 2015 (Mondulkiri Provincial Department of Tourism, 2016).
Willingness to pay, WTP
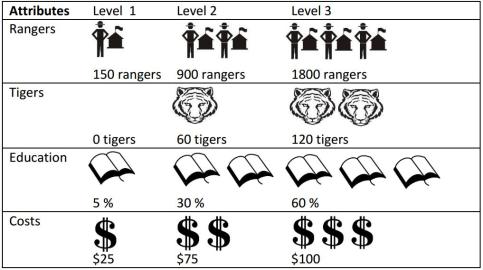
There are two classes of methods for estimating willingness to pay (WTP), which is the revealed preference (RP) and stated preference (SP) (Figure 3) (Boxall et al, 1996). The revealed preferences requires an actual market, where the actual preferences can be observed (Boxall et al, 1996). In cases where no real market exists, stated preference (SP) methods can be used (Boxall et al, 1996; Dasgupta, 2001). It has been shown that both RP and SP methods shows similar representations of the respondent’s choice behaviour (Boxall et al, 1996).
SP-methods include both non-use value and option value and can be used to value potential future or hypothetical goods and interventions. There are two main categories of SP methods: Contingent Valuation Methods (CVM) and choice modelling techniques, which includes Discrete Choice Experiment (DCE) (Competition & Commission, 2010; Dasgupta, 2001). For the CVM methods, there are both open ended questions and dichotomous questions. Dichotomous questions requires rather big sample sizes, and Alberini (2006) argues that a statistical power of 0.9 require a sample size of 1000 respondents. Due to limited time, open ended CVM method was used instead of Dichotomous questions, in combination with CEV method. The CVM method was integrated with a survey, and the CEV method was used through a questionnaire.
Open ended Contingent valuation method, CVM
In this study, the open ended Contingent Valuation Method (CVM) have been used in order to investigate a potential market of tiger tourism. This was formulated as the willingness to pay to participate in a tiger safari for a full day, with a guide, food and transportation included. Since 1960, CVM has been used in order to put an economic value on services and goods on a non-existing markets and has been used for environmental valuation for a long time (Boxall et al, 1996).
Choice experiment valuation, CEV
The Choice experiment valuation (CEV) origins from conjoint analyses, where choice behaviour is analysed (Boxall et al, 1996). The respondent is presented a choice exercise, where the respondent chooses the most preferred alternative from a selection of competing alternatives. The participants has to make a series of trade-offs between different choices, which reviles the importance of the attributes being used in the experiment (Adamowicz et al, 1998; Boxall et al, 1996). This method has been a common method when simulating consumer choices, and have in recent year been used in the field of conservation as well (Birol et al, 2006; Chau, 2010; Han et al, 2010). In conservation evaluation, different choices is presented as different conservation management, which is also the case in this study.
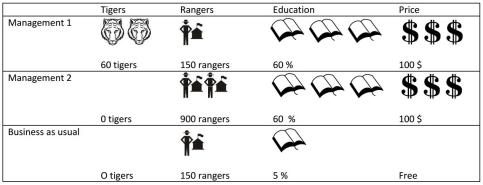
The different attributes in this study is as follows: amount of rangers, tigers, education and costs, all of them with three levels (Table 2). A full fractional design would require to test all the different combinations (3 x 3 x 3 x 3) resulting in 81 combinations. This is not a reasonable amount of questions to ask in a survey, as it would require a lot of time and the person who is conducting it will lose her/his interest. The risk of the respondent giving hasty answers without truly reflecting would therefore increase.
In order to decrease the number of questions, orthogonal fractional factorial design were used. This is based on an orthogonal main effect array, to ensure that the attributes presented to respondents are varied independently from one another and only consider some of the interactions (Louviere et al, 2000). The design and survey was taken forward using R, and the package support.CEs (Aizaki, 2012). Rotation design was used with a mix and match method, giving 9 questions with two alternatives each, see appendix for R script and full questionnaire. A “business as usual” was added to each question, with today’s level of rangers, tigers and education. This alternative was always free of cost. The answers were analysed though the conditional logistic regression, using the function Clogit in R. The marginal willingness to pay (MWTP), was calculated.
Multiple linear regression was used in order to determine factors that influences the stated WTP. The independent variables used was age, gender, education and household income. The program R was used (2015), with the function lm (fitting linear models).
Surveys
The two surveys described below were conducted by the researcher using in person method, which is recommended to get a high response rate (Dee Leeuw et al, 1996). Instructions about the research project were given before the self-administrated surveys were handed out. All the surveys were pre-tested and re-fined before finally being used in this study. Only people older than 18 years old were asked to participate in the surveys. For all surveys, a short section was about social data was collected. For an overview of the surveys (Table 3).
Questionnaire 1: Tourist profile, opinions and willingness to pay for a tiger safari
The focus group for the interview was tourists in Sen Monorom, and the interview was carried out using face-to-face method during September-November 2016 (see appendix for full survey). The researcher approached tourists in Sen Monorom, and asked if they had any tourism experience in the province. If they did, they were asked to participate in the study. Tourists who agreed were given a short background of the study as well as a self-administered questionnaire. The first interview was divided into two parts, collected through the same interview. The first part consists of questions to capture social data, complemented with some open ended questions about their trip, experience and perception about a tiger re-introduction. In order to collect the level of satisfaction of the ecotourism in Sen Monorom, a Likert-scale was used.
The second part consisted of a forced ranking experiment among ten different tour packages. The tour packages were made up but based on ongoing tourism in Sen Monorom, namely; elephant tour, bird watching, primate tour, motorbike tour, indigenous people, jungle trekking, waterfall tour, volunteering and ziplining. Also tiger safari was added, even though it did not exists in reality. The tour packages were designed as postcards in A5 format, with four coloured pictures on the activity on one side, and a descriptive text on the other side. The tourists were asked to sort the different tours in the order that they were interested in participate in each and one of them. After completing the ranking experiment, they were asked to state their willingness to pay for each tour, which is an open ended contingent valuation method (CEV).
The social data was collected in order to be able to do a multiple linear regression on the WTP. The open-ended questions were coded into different groups, and the proportions of the different groups were calculated. The ten most frequently answers is presented in the appendix. For the following-up questions about the opinion about why the tourists ranked the tiger safari as they did, different answers were grouped together in the categories “positive”, “neutral” and “negative”, judged by the author.
Questionnaire 2: Priorities and willingness to pay for different managements
The second survey targeted all people in Sen Monorom, both tourists but also local Khmer (Cambodian) and Bunong people (indigenous people). To be able to do this, a professional translator was hired. This questionnaire was according to the Choice experiment method (CEV). The survey form was designed with clip-arts in order to make it easier to understand the different attributes (Figure 4). People who agreed to participate were given a self-administered questionnaire. A total of 114 people participated in the survey.
Responsible for this page:
Director of undergraduate studies Biology
Last updated:
04/27/17