
Results
Space Sharing
Bioparc Valencia
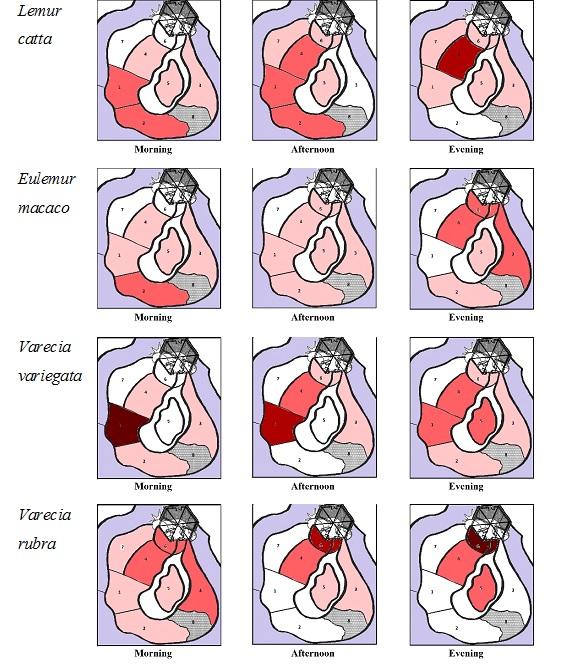
The figure 1 represents plot maps with the percentage of observation segments in each zone during the 3 different sessions by species in Bioparc Valencia.
Lemur catta spent more time during the morning and afternoon in zone 1 (79% and 57% respectively) and more time in Zone 4 (entrance to the indoor enclosure) in the evening (42%). Eulemur rufifrons spent more time in Zone 2 in morning session (60%) in afternoon session (77%) and evening session (61%). Varecia variegata spent more time in Zone 6 during the morning (60%) and afternoon (76%), and more time in Zone 2 during the evening (42%). Varecia rubra spent more time in Zone 6 during the morning (76%) and afternoon (80%) and more time in Zone 6 (entrance to indoor enclosure) in the evening (80%). Eulemur mongoz spent more time in Z7 during morning, afternoon and evening (90%, 91% and 67% respectively).

Bioparc Fuengirola
The figure 2 represents percentage of observation segments in each zone during the 3 different sessions by species in Bioparc Fuengirola.
Lemur catta spent more time in Zone 1 and Zone 2 in the morning (46% and 48% respectively) and more time in Zone 4 in the afternoon (39%) and evening (57%). Eulemur macaco spent more time in Zone 2 in the morning (62%), in Zone 4 in the Afternoon (74%) and Zone 4 and 6 in the Evening (38% and 40% respectively). Varecia variegata spent more time in Zone 1 in the morning and afternoon (91% and 74% respectively) and equal time in Zone 1 (26%), Zone 5 (25.5%) and Zone 6 (23.5%) in the evening. Varecia rubra spent more time in Zone 3 in the morning (46%) and Zone 6 in the afternoon and evening (60.5% and 80% respectively).
Resting & Locomotion
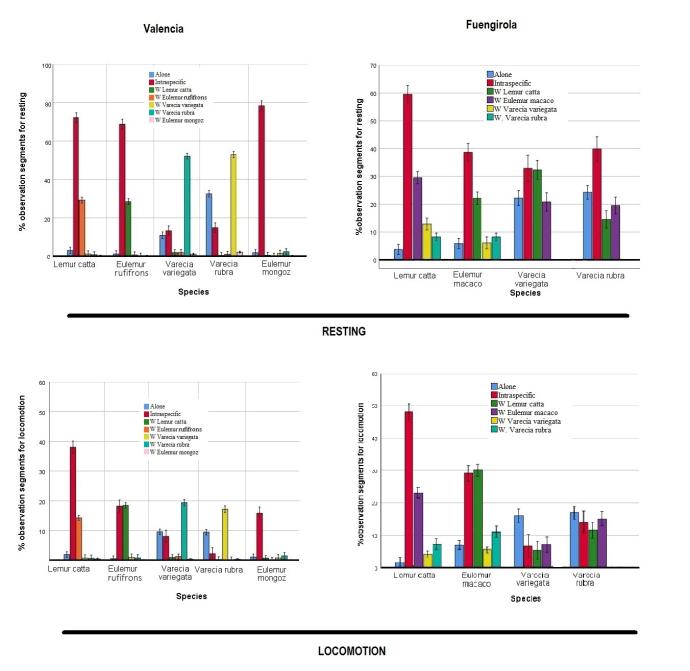
Figure 3 represents the mean percentage of observation segments (bars) which the individuals of each species rest (top graphs) and performe locomotion (bottom graphs) in a zone where they are alone, with their own species or with individuals of other species in Bioparc Valencia and Bioparc Fuengirola.
Resting
Valencia
Lemur catta performed resting with its own species a mean of 72%, resting in the same zone as E. rufifrons 29% and less than 4% resting one individual alone or with the other 3 species. Eulemur rufifrons performed resting with its own species a mean of 69%, resting in the same zone as L. catta 28% and less than 2% resting one individual alone or with the other 3 species. Varecia variegata performed resting with its own species a mean of 13%, resting in the same zone as V. rubra 52% and less than 2% resting one individual alone or with the other 3 species. Varecia rubra performed resting with its own species a mean of 15%, resting in the same zone as V. rubra 53%, resting one individual alone 32.5% and less than 2% resting with the other 3 species. Eulemur mongoz performed resting with its own species a mean of 78% and less than 3% resting one individual alone or with the other 4 species.
Fuengirola
Lemur catta performed resting with its own species a mean of 60%, resting in the same zone as E.macaco 30%, resting in the same zone as V.variegata 13% and less than 4% resting one individual alone or with the other V.rubra. Eulemur macaco performed resting with its own species a mean of 38%, resting one individual alone 6%, resting in the same zone as L. catta 22%, resting in the same zone as V.variegata 6% and resting in the same zone as V.rubra 8%. Varecia variegata performed resting with its own species a mean of 33%, resting one individual alone 22%, resting in the same zone as L.catta 32% and resting in the same zone as E.macaco 21%. Varecia rubra performed resting with its own species a mean of 40%, resting one individual alone 24%, resting in the same zone as L.catta 14.% and resting in the same zone as E. macaco 19%.
Locomotion
Valencia
Lemur catta performed locomotion with its own species a mean of 38%, in the same zone as E. rufifrons 14% and less than 2% alone or with any other species. Eulemur rufifrons performed locomotion with its own species a mean of 18%, in the same zone as L.catta 18% and less than 1% alone or with any other species. Varecia variegata performed locomotion with its own species a mean of 8%, in the same zone as V.rubra 19%, an individual alone 9% and less than 2% alone or with any other species. Varecia rubra performed locomotion with its own species a mean of 2%, in the same zone as V.variegata 17%, an individual alone 9% and less than 2% with any other species. Eulemur mongoz performed locomotion with its own species a mean of 15% and less than 2% alone or with other species.
Fuengirola
Lemur catta performed locomotion with its own species a mean of 48%, in the same zone as E. macaco 23%, in the same zone as V. rubra 7% and less than 5% performing solitary locomotion or in the same zone than V. variegata. Eulemur macaco performed locomotion with its own species a mean of 29%, in the same zone as L.catta 30%, in the same zone as V. variegata 5%, in the same zone as V.rubra 11% and solitary 6%. Varecia variegata performed locomotion with its own species a mean of 7%, in the same zone as L.catta 5%, in the same zone as E.macaco 7% and solitary 16%. Varecia rubra performed locomotion with its own species a mean of 14%, in the same zone as L.catta 11%, in the same zone as E.macaco 15% and solitary 16%.
Affiliative behaviour
Grooming and play
Figure 4 represenst the mean percentage of observation segments (bars) which the individuals of each species groom themselves, a conspecific or an individual of other species (top graphs) and the mean percentage of observation segments which the individuals play with another individual the same species or a different species (bottom graphs).
Grooming
Valencia
Lemur catta groom themselves a mean of 23% and a conspecific a mean of 12%. Eulemur rufifrons groom themselves a mean of 6% and a conspecific a mean of 6%. Varecia variegata groom themselves a mean of 12% and a conspecific a mean of 2.5% and an individual of V. rubra 2%. Varecia rubra groom themselves a mean of 14% and a conspecific a mean of 2% and an individual of V. variegata 2%. Eulemur mongoz groom themselves a mean of 6% and a conspecific a mean of 4%.
Fuengirola
Lemur catta groom themselves a mean of 14% and a conspecific a mean of 20% and less than 2% groom other species. Eulemur macaco groom themselves a mean of 10% and a conspecific a mean of 5% and less than 1% groom other species. Varecia variegata groom themselves a mean of 9% and a conspecific a mean of 9%, an individual of E. macaco 4% and an individual of L.catta 2.5%. Varecia rubra groom themselves a mean of 16% and a conspecific a mean of 2%.
Play
Valencia
Lemur catta performed this behaviour once observation segment with a conspecific (0.01%) and once with E.rufifrons (0.01%). Eulemur rufifrons performed play with a conspecific a total of 19 observation segments (0.18%). Varecia variegata performed play with a conspecific a total of 6 observation segments (0.06%) and 8 observation segments with V. rubra (0.08%). Varecia rubra performed play a total of 10 observation segments with V. variegata (0.1%). I did not observe any occurrences for play in Eulemur mongoz.
Fuengirola
Lemur catta performed this behaviour with a conspecific a mean of 2.5% and with E.macaco 2.3%. Eulemur macaco performed play with a conspecific a mean of 0.06% and with L.catta 2.5%. Varecia variegata performed play with a conspecific a mean of 0.6%. I did not observe any occurrences for play in V.rubra

Agonistic behaviour
Chase and attack
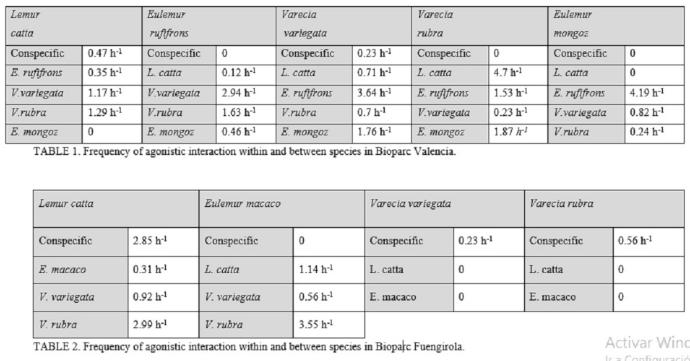
Tables 1 and 2 represent the mean frequency of agonistic behaviour (occurrences per hour) from one individual toward an individual of the same species and towards an individual of a different species in Bioparc Valencia (top) and in bioparc Fuengirola (bottom).
Responsible for this page:
Director of undergraduate studies Biology
Last updated:
05/10/19