
Results
A total of 18,775 individuals belonging to 130 species of saproxylic beetles were found on the 51 revisited trees in 2018, compared to 108 species on the same trees in 1994. Overall, 139 species made up the total species community between the two years. Further, six standing dead trees were encountered among the revisited trees, and it was observed that the species composition on these dead trees did not differ much compared to the living trees. In addition, 93 species increased in occurrence (i.e. number of host trees) and 36 species decreased in 2018.
Comparison based on Ecological groups
Some studies suggest that the species composition may be explained by habitat requirements and ecological characteristics, therefore comparisons were also made on ecological characteristics based on feeding habits.
Feedings Habits
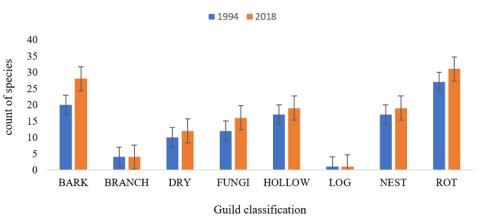
There were more species in each guild in 2018 compared to 1994, with more BARK and ROT feeding species recorded in 2018 (Fig. 1)..
Species turnover and species association with explanatory variables
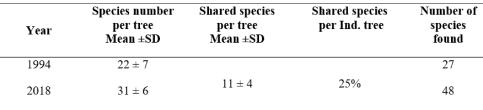
There were 99 (71% ) shared species between 1994 and 2018, 31 (22%) new species recorded in 2018 and 9 (6%) species lost from the study in 1994. Among the 31 new species , 11 species were singletons and 20 species were represented by 354 individuals, adding up to a total of 365 new individuals (i.e. ca 1.9 % of the total number of individuals found in 2018). The average number of shared species per individual tree was 11 species (t = -7.27, df = 98.8, p = 1.657e-10). The number of species found per tree in 2018 i.e. 31 species, was more compared to species found in 1994 (Fig. 2).
Multivariate Analysis:
Detrended Correspondence Analysis (DCA)
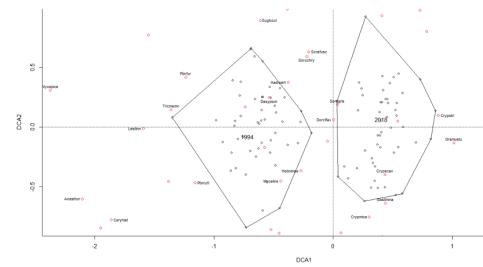
The DCA and CCA mainly analyzed the joint composition of 1994 and 2018.There was a clear difference in species composition between the two years, this was seen by the pattern in which the sites clustered along the DCA 1 axis (Fig. 3), this was an indication that the effect of the year had the strongest gradient.
Further Probing
Generalised Linear Model
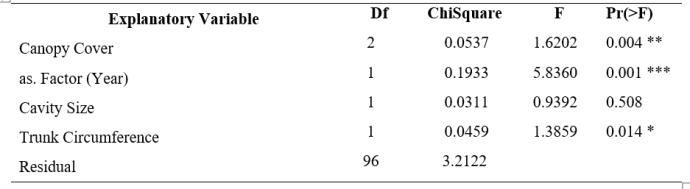
The permutation test of the CCA showed that canopy cover and trunk circumference (p-value 0.004, 0.014 respectively), had a statistically significant effect on species composition. This probably meant there might be species e.g. Anisoxya fuscula, Dasytes aeratus, that consistently prefer large trees/low canopy cover. The factor of year (p-value 0.001) was also statistically significant, an indication that the observed difference in species composition was also explained by the different years (Fig. 5).
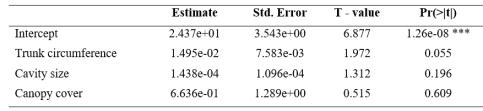
However, the general association between explanatory variables and species number in 2018 did not reveal any statistically significant effect, therefore it was not known how each factor influenced the observed change in species number (Fig. 4).
Canonical Correspondence Analysis permutation test
Testing for the association of explanatory variables in 1994 and 2018, with species composition as the response variable
Responsible for this page:
Director of undergraduate studies Biology
Last updated:
09/01/19