
Results
Artificial Sweeteners
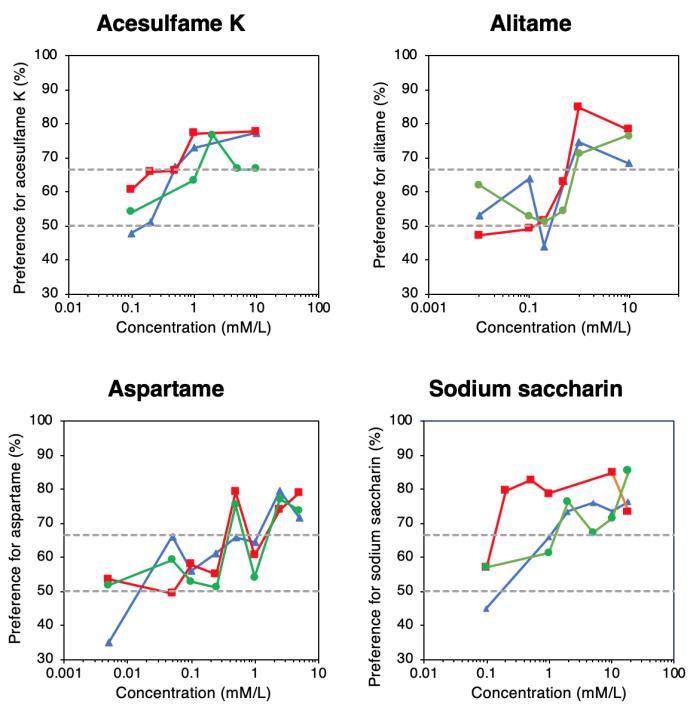
The taste preference thresholds for acesulfame K were 0.5 mM for Pippi, 1 mM for Kankan and 2 mM for Jonatan (P <0.05, binomial test) (Fig. 2). The mean taste preference threshold for acesulfame K was 1 mM. For alitame, the taste preference threshold for all three animals was 1 mM (P <0.05, binomial test) (Fig. 2) and thus the mean taste preference threshold was also 1 mM. The taste preference thresholds for aspartame were 0.5 mM for both Jonatan and Kankan and 2.5 mM for Pippi (P <0.05, binomial test) (Fig. 2). The mean taste preference threshold for aspartame was 0.5 mM. The taste preference thresholds regarding sodium saccharin were 2 mM for both Pippi and Kankan and 0.2 mM for Jonatan (P <0.05, binomial test) (Fig. 2). The mean taste preference threshold for sodium saccharin was 1 mM.
Sweet-tasting proteins and amino acids
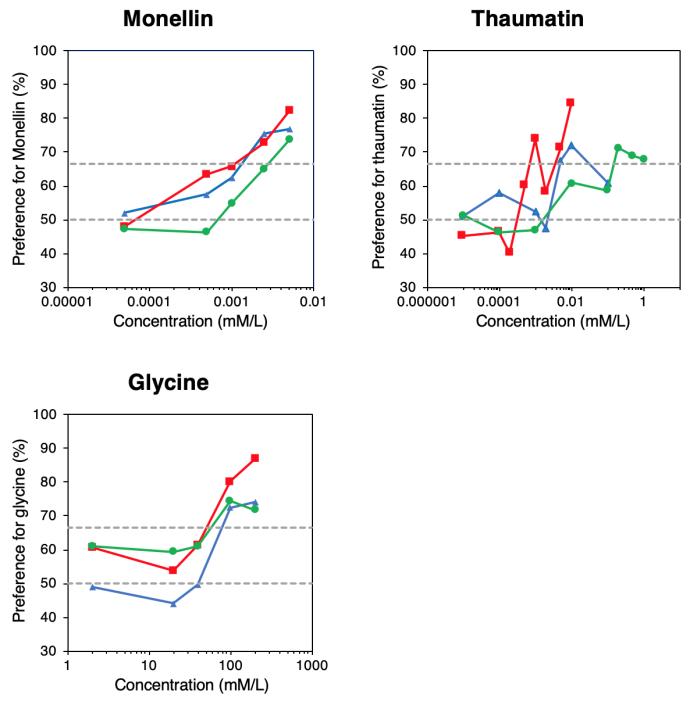
The taste preference thresholds for monellin were 0.0025 mM for both Pippi and Kankan and 0.005 mM for Jonatan (P <0.05, binomial test) (Fig. 3). The mean taste preference threshold for monellin was 0.0025 mM. For thaumatin, the taste preference thresholds were 0.005 mM for Pippi, 0.001 mM for Kankan and 0.2 mM for Jonatan (P <0.05, binomial test) (Fig. 3). The mean taste preference threshold for thaumatin was 0.01 mM. Regarding glycine, the taste preference threshold for all three animals was 100 mM (P <0.05, binomial test) (Fig. 3) and thus the mean taste preference threshold was also 100 mM.
Sweet-tasting saccharides
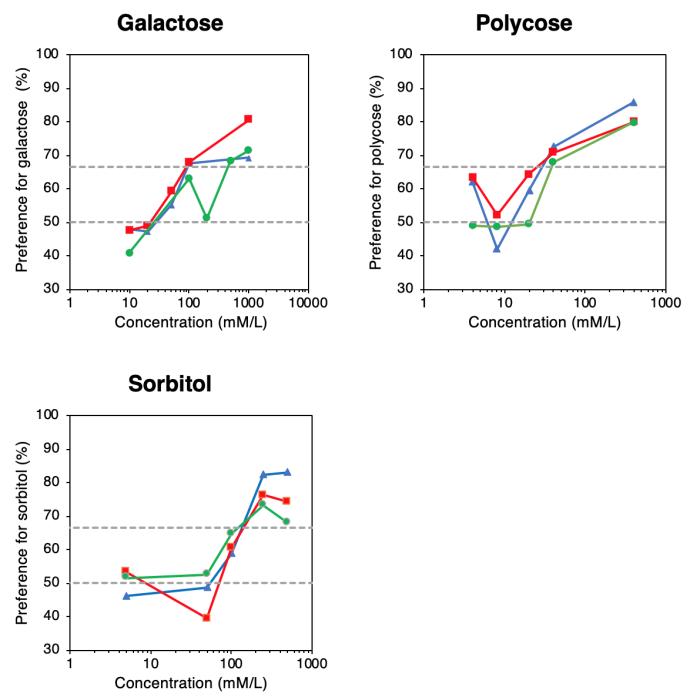
The taste preference thresholds for galactose were 100 mM for both Pippi and Kankan and 500 mM for Jonatan (P <0.05, binomial test) (Fig. 4). The mean taste preference threshold for galactose was 500 mM. The taste preference threshold for polycose for all three animals was 40 mM (P <0.05, binomial test) (Fig. 4) and thus the mean taste preference threshold was also 40 mM. For sorbitol, the taste preference threshold for all three animals was 250 mM (P <0.05, binomial test) (Fig. 4) and thus the mean taste preference threshold was also 250 mM.
Responsible for this page:
Director of undergraduate studies Biology
Last updated:
05/06/19