
Materials & Methods
Study sites, sampling and collection of data
Oaks representing three different managments were studied in this master thesis. Those were Formerly thinned, recently thinned and unmanaged areas, The Formerly thinned and unmanaged areas were picked by using data from an inventory made by the county administrative board between 1997 and 2008, and the oaks representing recently thinned areas were picked from a data-set by Swedish forest agency about oak areas thinned during autumn 2017 and winter 2018. Thinned areas are according to the administrative board of Östergötland, areas with oaks worth of conservation.
The formerly thinned and recently thinned trees were sampled randomly in Excel (but from two different data-files). To select unmanaged oaks, ArcMap were used to select by location. The layer with selected formerly thinned areas was used to find oaks outside the thinned areas by search for oaks (with a perimeter over 314 centimetre) within a maximal distance of one kilometre outside the selected formerly thinned areas. Three of these oaks were picked and the leaves were sampled from the selected oaks.
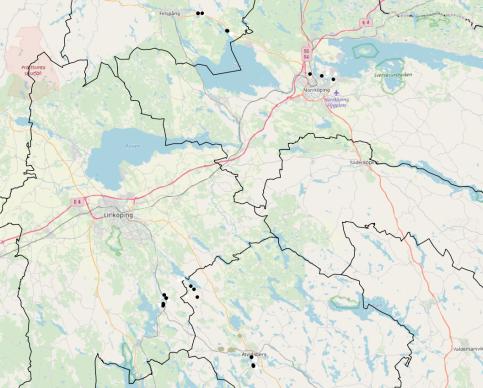
The selected oaks from the different management were found in Linköping, Norrköping, Finspång, Åtvidaberg and Kinda municipalities (Fig 1).
The oaks that were selected were standing in different habitats depending on sites. Many of the oaks were standing in grazed pastures with short vegetation, but some was standing in roadsides, mixed overgrowth forests with Eurasian aspen (Populus tremula), Birch (Betula pendula) and other broad-leave tree species and some was standing in small glades of oaks (Quercus robur) and hazel (Corylus avellana).
The typical sun or shade-leaves morphological parameters studied in this study are vitality, leaf weight, leaf weight per area, stomata density, leaf thickness, canopy cover and tree density. Those parameters were selected because other studies have shown clear
Ten leaves were sampled from every oak. Two leaves were sampled from the north and the south side each and three leaves from the western and eastern side each. The tools used to sample the leaf were a manual hedge trimmer, a branch saw with long shaft and a stick.
The explanatory variables in this study were tree density and canopy cover. The tree density was measured by adding the sum of the diameters of all standing trees or stumps (in thinned areas) at a maximal distance of two meters around the crown of every sampled oak by using a tree calliper. The canopy cover was measured by a clinometer at the south side of every selected oak. Before the fieldwork, Prognosen.se were used to know the solar angles in every direction. During the summer solstice, sunrise is in northeast, the solar angle is 28° in west and east and 55° in south and sunset is in northwest. Canopy cover was measured by estimating how many percent of the sun path which was covered by other trees, branches or buildings which could block the sunlight from reaching the oak .
The response variables investigated in this study is vitality, leaf weight, leaf weight/cm2, leaf size, leaf thickness and stomatal density. The vitality was measured by studying the crown condition and estimate how many percentages of the leaves remained in the crown. The weight of fresh leaves was determined with a Sartorius Research R 160 P scale, to the closest 0.1 mg. The leaf size was measured by draw the shape of the leaves on a square centimetre paper and summarize all the partly filled and filled squares. The leaf weight per area were calculated by divide the weight of every leaf with the size of the associated leaf. The leaf thickness was measured with a micrometer on three random places on the leaves. The thickness was measured to the closest 0.01 mm. Stomatas are tiny openings on the leaf surface that open and close to regulate water loss and gas exchange (Sadava et al. 2016). To measure the stomatal density, a small part of the underside of every leaf was covered by transparent nail polish (leaf-veins were avoided). Transparent tape was attached on the dry polish and then pulled off. The tape was attached to slides and studied under a light microscope and the number of stomatas was calculated in one square millimetre.
Responsible for this page:
Director of undergraduate studies Biology
Last updated:
05/10/19