
Results
It is no clear correlation between the studied explanatory variables and their impacts on the studied response variables.
One of the six investigated response variables were significant affected by the explanatory variables. Leaf thickness was significant affected but only if treatment and Tree density or Canopy cover were combined. For the other response variables, no significant effects were found between different response and explanatory variables (Table 2). Based on P-values from table 1 and means from table 2 (table 2). It is non-significant trends that leaf weight/cm2 are close to be significant when it is combined with canopy cover. Four of eight means were lowest in the recently thinned areas (stomatas, leaf size, leaf weight and tree density). Two means were lowest both in the unmanaged (leaf thickness and canopy cover) and formerly thinned areas (leaf weight/cm2 and tree vitality). When all explanatory and response variables were merged together, the R2value for the hole model are 8% and that is no significant p-value.
Table 1. Linear model of six response variables with interaction between time since conservation thinning and canopy cover or tree density. The p-value tests the hypothesis of no effect of the explanatory variable on the response variable. The test analyses if the explanatory variables are positively or negatively related to the measured response variables. P>0,05.
|
Table 2. Leaf anatomy variables representing the three treatments studied: stomatal density (numbers/mm2), leaf blade thickness (µm), leaf size (cm2), leaf weight (g), vitality (%), Canopy cover (%) and weight/cm2 (g/cm2). Data are the means and SD from the 72 oaks visited oaks. DF=2
|
||||||||||||||||||||||||||||||||||||||||||||||||||||||||||||||||||||||||||||||||||||
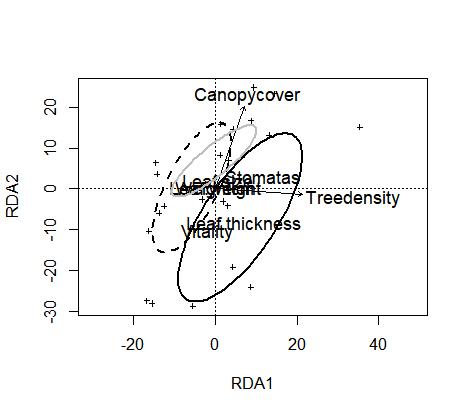
The RDA plot (fig 1) are showing that two groups (Recently thinned areas and unmanaged area) are close related to each other. It also showing that the formerly thinned areas are separated from the others. Two different analysis were preformed to investigate if the three groups are statistically separeted from each other. Both show non-significant differences (table 3).
Table 3. One-way ANOVA studying if the different axis is separated from each other and if the different parameters are separated from each other. Data is the P and F-values and the DF for every test.
|
Responsible for this page:
Director of undergraduate studies Biology
Last updated:
05/22/19