
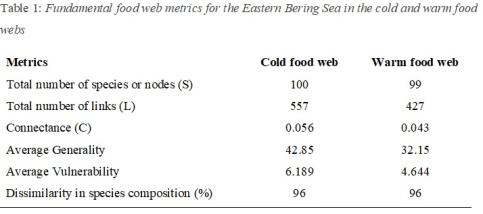
Food web metrics
Results calculated for the EBS food web in the cold and warm regimes in this study shows relatively small differences. All the food web metrics were recorded higher in the cold food web than in the warm food web, and the calculated dissimilarity in species composition between the two food webs was 96 % (Table 1) . The average generality represents the mean generalities of the individual predators and average vulnerability represents the mean vulnerabilities of individuals preys.
Functional groups result
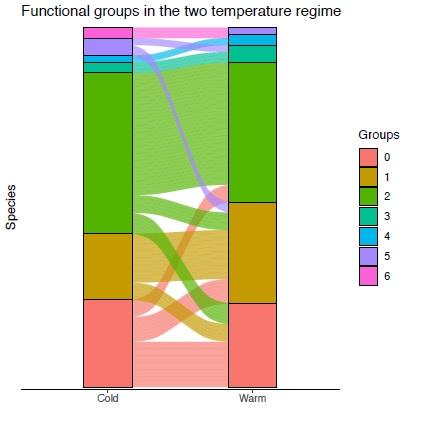
The total 100 species (the 13 predators with respective prey species) were grouped into 7 groups in the cold regime and 6 groups in the warm regime (Figure 3). A total of 32 species out of the 100 total species changed from a particular group in cold regime to a new group in the warm regime, while 71 species maintained the same group across the two temperature regime. Of the 32 species that changed groups 6 were predators and 26 were prey species, which indicates that about 50% of the predator species changed groups.
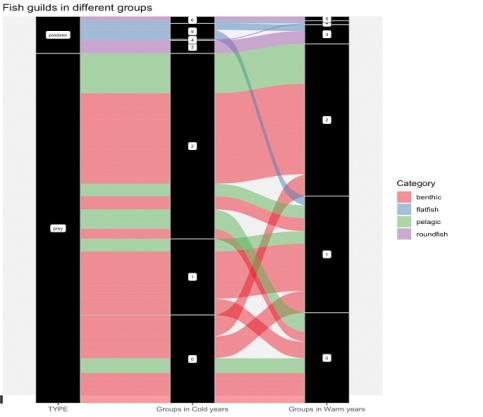
The results also shows how species from different ecological guilds changed groups between the cold and warm regimes as highlighted in Figure 4. It indicates the turnover of the fish guilds between the two temperature regimes for groups 5, 2, 1, 0. The calculated turnover of the fish guilds was 14 % and 83 % for roundfish and flatfish respectively, 23 % and 22% for pelagic and benthic respectively.
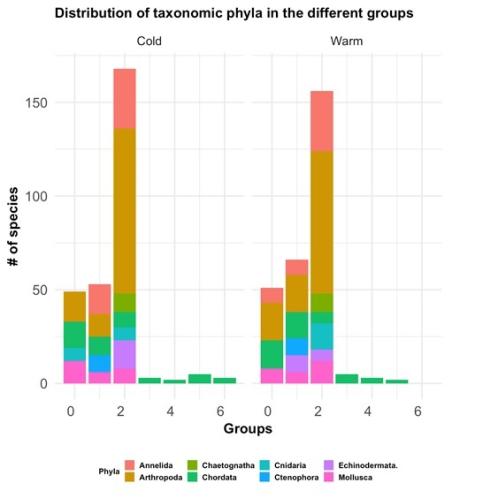
The taxomonic analysis shows that the different groups both in the cold and warm years had high phyla diversity as can be seen in Figure 5 . Group 0 to 2 were more diverse than group 3 to 6 in both periods. However, there was variaton in the phyla composition in groups 0 and 1 between the two periods with higher numbers of phyla in the warm years. for instance phylum Cnidira was present in group 0 in the cold year but absent in group 0 in the warm years and vice versa for phylum Annelida. There was also variation in some of phylum diverse in the different groups between the two period good example is Arthtopoda was more diverse in group 0 and 1 in the warm years than in the cold years.
Responsible for this page:
Director of undergraduate studies Biology
Last updated:
10/27/19