
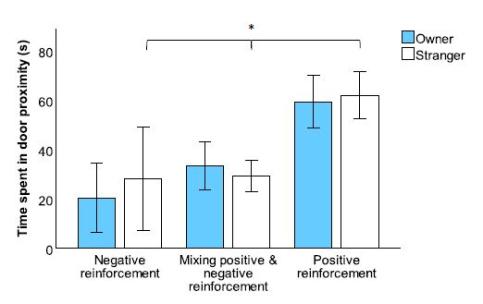
Figure 1. Mean time (s) horses spent in door proximity across the different training groups Negative reinforcement (N=4), Mixing positive and negative reinforcement (N=13), and Positive reinforcement (N=9) during separation episode when tested with either the owner (blue bars) or the stranger (white bars). Whiskers indicating 1±SE and *=p<0.05.
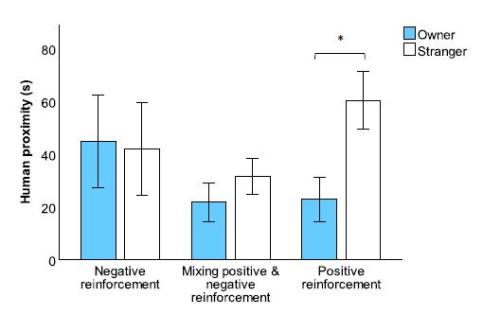
Figure 2. Mean time (s) horses spent in human proximity across the different training groups Negative reinforcement (N=4), Mixing positive and negative reinforcement (N=13), and Positive reinforcement (N=9) during reunion episode when tested with either the owner (blue bars) or the stranger (white bars). Whiskers indicating 1±SE and *=p<0.05.
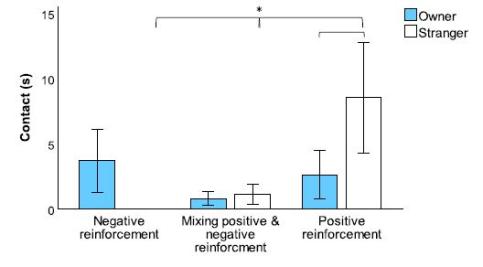
Figure 3. Mean time (s) horses spent in contact across the different training groups Negative reinforcement (N=4), Mixing positive and negative reinforcement (N=13), and Positive reinforcement (N=9) during reunion episode when tested with either the owner (blue bars) or the stranger (white bars). Whiskers indicating 1±SE and *=p<0.05.
Responsible for this page:
Director of undergraduate studies Biology
Last updated:
06/26/19