
Results
Memory and Spatial Cognition
Half of the study subjects completed IR phase with at least 75% successful trials (Binomial test, p<0,05). These donkeys still performed above chance level (at least 60% successful trials) during DR trials (Binomial test, p<0,05). Average success rate between individuals was 0,66 ± 0,06 for IR Memory trials (N=12), and 0,66 ± 0,05 for DR Memory trials (N=6).
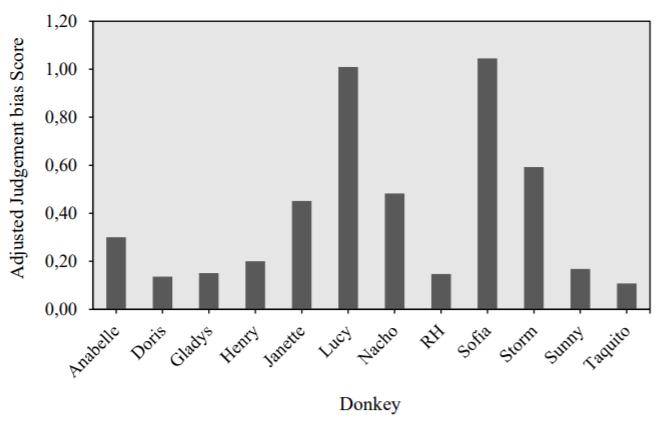
Judgement bias
During DL phase, the group average latency to approach the positive stimulus was 30,3±34,4 seconds, and 77,2±65 seconds to approach the negative stimulus. During Treatment phase, the mean latencies to approach the stimuli were 33,7±43,1 seconds (positive), 37,9±50 seconds (A+), 85±70,3 seconds (A), 91,5±71,4 seconds (A-) and 145,5±53,1 seconds (negative) (N=12). Latencies to approach the ambiguous stimulus (An) varied between individuals and were plotted in Fig. 1.
Detour behavior
The mean latencies to reach the bucket of food were 19,9s (D0 trials, N=11), 17,2s (D1 trials, N=11) and 23,3s (D2 trials, N=11). During D0 trials, nine individuals showed a side preference to go around the barrier, and the same results were observed in D1 trials (Binomial test, p <0,05) (Fig. 2). Throughout D2 trials, nine individuals showed the same side preference as they had for D0 and D1, one individual demonstrated no side preference, and one individual revealed a side preference for the shorter detour around the barrier (Binomial, p <0,05) (Fig. 3). No side preference was found at a group level (Binomial, p <0,05).
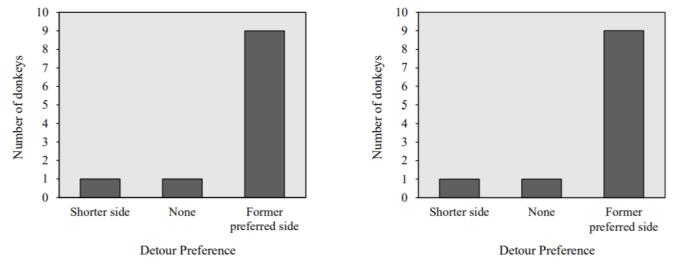
Fig. 2. Side preferences during D0 and D1 trials. Fig. 3. Existence of a side preference during D2 trials.
Correlations
A significant correlation was found between the personality factor Concentration and the Mean Detour Latency to go around the barrier during the U-task (rs=-0,657, p<0,05) (Fig. 4), as well as between Patience and the Latency to complete the D1 phase of the U-task (rs=0,766, p<0,01) (Fig. 5). Moreover, Predictability was found to be positively correlated with Memory performance during IR trials (rs=0,666, p<0,05) (Fig. 6). Lastly, a positive correlation was found between Patience and negative Judgement bias (rs=0,714, p<0,01) (Fig. 7).
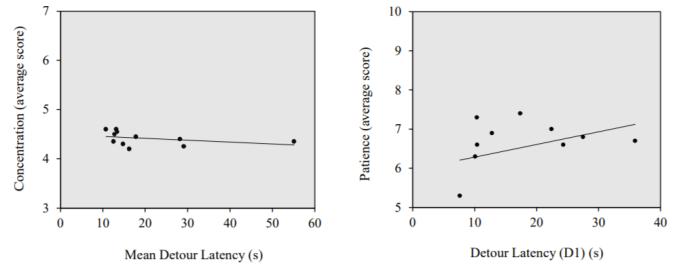
Fig. 4. Scatterplot and trend line of the correlation between Fig. 5. Scatterplot and trend line of the correlation between Concentration and the Mean Detour Latency to reach the Patience and Detour Latency during D1 trials, U-task. food bucket during U-task trials.
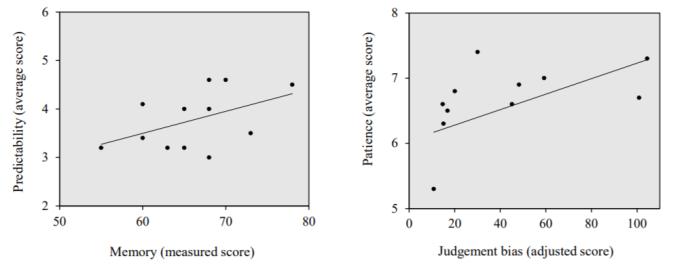
Fig. 6 Scatterplot and trend line of the correlation between Fig. 7. Scatterplot and trend line of the correlation between Predictability and Memory. Patience and Judgement bias.
Responsible for this page:
Director of undergraduate studies Biology
Last updated:
05/15/20