
Results
1) Cognitive bias
- The control group and the hatchery group did not differ in their performance under the mirror cue.
- Start latencies: there was a significant effect of the pictures on the start latencies where the hatchery chicks exit the start box faster with the chick image as a goal than with the owl morph, where both group exited the start box faster under the chick image than under the ambiguous image, and where both group had shorter start latencies with the ambiguous picture than with the owl picture. There was no difference between the hatchery group and the control group (Figure 6a). Indeed, there was no effects of the treatment on the start latencies. However, the hatchery group was slower than the control group to exit the start box under the owl picture.
- Goal latencies: The hatchery group was overall slower than the control group in reaching the goal line. Indeed, there was an effect of the pictures on the goal latencies with both group reaching the goal line faster under the chick picture than under the owl picture, with the control group having shortest goal latencies under the chick picture than the ambiguous picture, and shortest latencies under the ambiguous picture than the owl picture. Finally, there was a tendency for the hatchery group to be slower than the control group in reaching the goal line under the chick picture, along with a significant treatments effect and a significant interaction treatments*pictures.
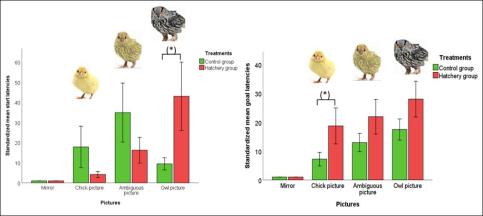
Standardized mean latencies to exit the start box and to reach the goal line for the control group and the hatchery group when presenting to a mirror, to the chick picture, to the ambiguous picture and to the owl picture (groups mean ± SEM are shown).
2) Short-term memory
- None of the number of correct, incorrect and null choices made by the control and hatchery groups are above 50% chance.
- The hatchery group made more correct choices and fewer null choices than the control group at delay 30 sec.
- No other difference was found between the two treatments across the different delays.
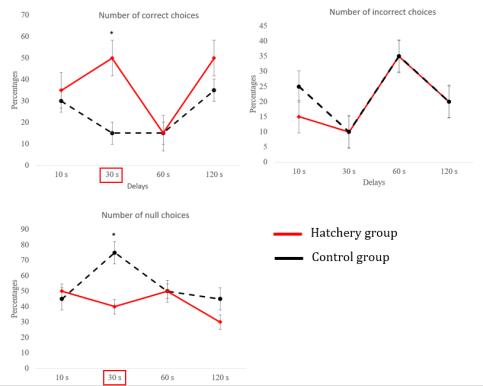
Number of correct, null and incorrect choices made by the control group (CC) and the hatchery group (HC) after a delay of 10s, 30s, 60s and 120s (groups mean ± SEM are shown).
3) Long-term memory
- The chicks went through a training session made of five tests. There was no difference between the control group and the hatchery group for any of the trials. However, within the hatchery group, the chicks were slower to find the correct entrance during the first trial than compare to the second trial, the third trial, the fourth trial and than the fifth trial. Additionally, the control group was significantly slower in finding the correct entrance during the first trial than during the second trial, the fourth trial and than the fifth trial.
- The control group and the hatchery group did not differ in recalling where the open door was one hour after the training session and three hours after the training session
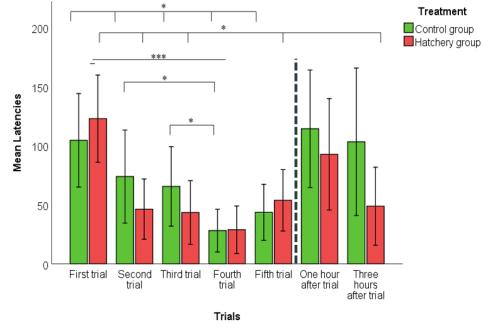
Mean latencies (s) to find the correct entrance during the training session (First, second, third, fourth, fifth trial) and one hour and three hours after that training session (groups mean ± SEM are shown).
4) Sociality test
Chicks of both groups spent main part of the experiment in the social area and few of them explored the neutral area and the behind-screen area (Figure 13).
The hatchery chicks spent less time than the control group in the behind screen area (P=0.018) (Figure 13). They also spent more time than the control group in the social area (P=0.068)
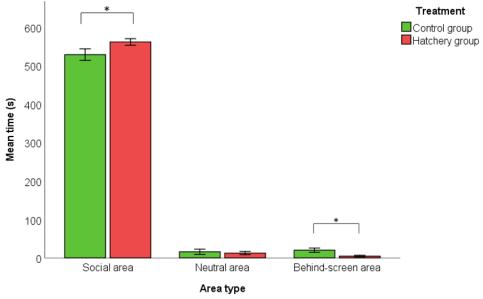
Mean time (s) spent in the social, neutral and behind-screen area by the control and the hatchery group during the 10 mn experiment (groups mean ± SEM are shown).
Responsible for this page:
Director of undergraduate studies Biology
Last updated:
05/27/20