
Results
Comparisons between responses from original tests
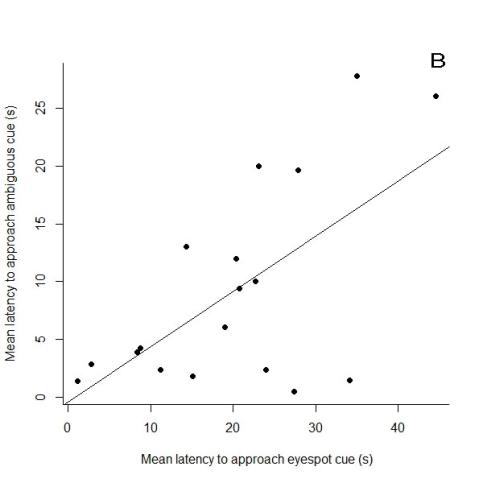
Latency to approach the middle grey cue in the judgement bias test tended to positively correlate with relative mean distance from cue 3 (RS = 0.45, n = 18, p = 0.06), and latency to cue 3 (RS = 0.39, n = 18, p = 0.11) in the eyespot test, but only in females. When removing effects of learning that the ambiguous cue was unrewarded, the relationships were not disrupted. Latency to approach the middle grey cue was positively correlated with distance from cue 3 (RS = 0.47, n = 18, p = 0.05) and tended to positively correlate with latency to approach cue 3 (RS = 0.41, n = 18, p = 0.09). Cue 3 was one of the two full eyespot cues. No ambiguous eyespot cue showed any significance in correlations of responses from the two tests.
Comparisons between responses from simplified tests
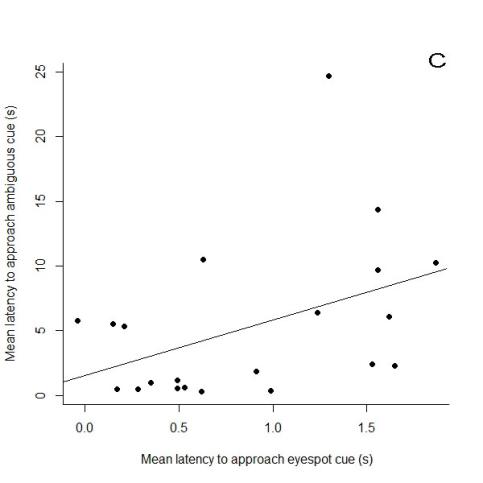
Latency to approach the middle grey cue in the judgement bias test was positively correlated with latency to approach cue 3 (RS = 0.46, n = 21, p = 0.04), but only in the second test array, when chicks were four-week-old. When removing effects of learning that the ambiguous cue was unrewarded, the relationship was disrupted (RS = 0.02, n = 46, p-value = 0.87).

Comparisons between responses from affective state tests with removal of outliers
In the original tests, removing two potential error outliers disrupted:
- The positive tendency in the relationship between latency to approach the middle grey cue and distance from cue 3 when effects of learning loss of ambiguity were removed.
- The positive tendency in the relationship between latency to approach the middle grey cue and latency to approach cue 3 when effects of learning loss of ambiguity were removed.
In the simplified tests, removing 13 potential error outliers in the first test array made the comparison between latency to the middle grey cue and latency to cue 3 positively significant when effects of learning loss of ambiguity were removed.
In the simplified tests, removing one potential error outlier in the second test array made the comparison between latency to the middle grey cue and latency to cue 3 show positive tendency.
Responsible for this page:
Director of undergraduate studies Biology
Last updated:
05/14/21