
Bioinformatics
The predicted sequence information was obtained from ExPASy, NCBI, TAIR, MIPS, ARAMEMNON or PPDB. ExPASy provides tools like TargetP, MITOPROT, Predotar, PSORT etc. that helps predict sub-cellular location. MITOPROT and Predotar focuses on prediction of mitochondrial targeting and plastid targeting sequences45. The theoretical isoelectric point and molecular weight of the protein of interest was computed from a UniProt knowledge base45. For the structure and localization of the protein, it is important to know about how hydrophobic or hydrophilic the amino acids comprising the protein are, and how they are arranged into the membrane. Since the protein of interest is a predicted transporter, this piece of information is of great importance. ARAMEMNON is a specialized database for Arabidopsis membrane proteins that facilitates the interpretation of gene and protein sequence data46. This enables direct comparison of the predictions of seven different TM span computational programs and the predictions of sub-cellular localization by eight signal peptide recognition programs46.
Another membrane protein topology prediction method, TMHMM, based on a hidden Markov model discriminates between soluble and membrane proteins with both specificity and sensitivity47 while HMMTOP transmembrane topology prediction server predicts both the localization of helical transmembrane segments and the topology of transmembrane proteins48. PROSITE and Pfam consists entries describing protein domains, families and functional sites along with hidden Markov models49. Genevestigator allows biologists to study the expression and regulation of genes in a broad variety of contexts by summarizing information from hundreds of micro-array experiments into easily interpretable results50. This also allows the visualization of gene expression in many different tissues, at multiple developmental stages, or in response to large sets of stimuli, diseases, drug treatments, or genetic modifications50.
Plant material and growth conditions
Seeds were normally stored in dark at 4oC. During sterilization they were placed in a piece of miracloth, wrapped and pinned up. They were then soaked in 70% ethanol for about 5 minutes and then washed with 0.5 % SDS for 15 minutes. The seeds were washed with sterile water for 3 or 4 times and incubated in it for about 5 minutes. They were then opened up in a petridish and dried in a hood.
Meanwhile pipette tips were melted and arranged into the boxes into which agar solution (0.7 % agar with nutrient solution) was added. After the agar dried up, a seed was planted on top of the agar (care should be taken not to bury the seeds). After a short period of vernalization at 4oC (3-5 days), the seeds planted in the boxes were transferred to the plant room, where they were incubated for 2-3 weeks. After a period of about 3 weeks, trays were prepared with the hydroponic setup (200 ml nutrient solution was aerated and mixed with water).
The plantlets were sprayed with water regularly until ready for harvest. The plant growth room was maintained at a temperature of 22oC and 70% relative humidity with 8 hours of daylight and 16 hours of dark.Screening of Mutants
Isolation of genomic DNA from leaves
Leaf tissue was grinded in 40 µl of shorty buffer (see appendix). 460 µl of this buffer was added to rinse the pestle. The crushed tissue was centrifuged at high speed for 7 minutes and 400 µl of the supernatant was transferred into an Eppendorf with the same amount of isopropanol making sure the pellet at the bottom was not disturbed. It was then mixed by inverting the tube for about 7 times and centrifuged for 15 minutes at high speed. The supernatant was then poured out and the samples were left to dry out. When the samples were dried, they were dissolved in 100 µl of TE1 buffer.
Polymerase chain reaction
The polymerase chain reaction (PCR) is a fast and reliable technique used to amplify or copy small segments of DNA. Since there is a need for significant amounts of DNA for genetic analysis, studies of genes or gene segments become impossible without PCR amplification. To amplify a segment of DNA using PCR, the sample was first heated to denature DNA which separates it into two pieces of single-stranded DNA 44. Next, a heat resistant enzyme called Taq polymerase synthesizes two new strands of DNA, using the original strands as templates. This process results in the duplication of the original DNA, with each of the new molecules containing one old and one new strand of DNA. Then each of these strands can be used to create two new copies, and so on. The cycle of denaturing and synthesizing new DNA is repeated as many as 30 or 40 times, leading to more than one billion exact copies of the original DNA segment. The entire cycling process of PCR is automated and can be completed in just a few hours. It is directed by a machine called a thermocycler, which is programmed to alter the temperature of the reaction every few minutes to allow DNA denaturing and synthesis44.
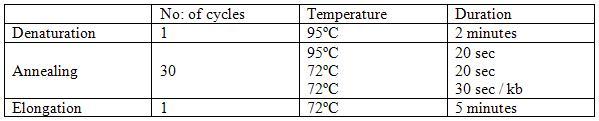
The PCR mix was prepared first by adding the components into a nuclease-free microcentrifuge tube and mixed. The DNA polymerase used in this reaction was Paq5000 DNA polymerase, a recombinant DNA-dependent DNA polymerase isolated from Pyrococcus species. This reaction mixture was placed in a thermo-cycler and a polymerase chain reaction was carried out according to the steps in table 1.
The PCR was programmed in accordance with the above steps and the hold temperature at 4ºC.
The PCR products were then analyzed by using Agarose gel electrophoresis.
Agarose gel electrophoresis
Agarose gel electrophoresis is a method for separating, viewing and analyzing DNA. This makes use of a gelling agent, agar obtained from cell walls of some species of red algae primarily from genera Gracillaria or Gelidium. DNA fragments move through the pores in the gel and get separated on basis of their charge:size ratio. DNA molecules, due to their phosphate backbone are negatively charged so they migrate towards the positively charged anode. The size of the pore (concentration of agarose) is decided according to the size of DNA fragments. The buffer used in this technique was Tris borate buffer (TBE). The DNA was viewed by a fluorescent dye, Ethidium bromide as it gets intercalated between nucleic acid bases and fluoresces under UV light.
The 0.8% agarose was prepared by heating the constituents in appropriate amounts until the agarose melts completely. It was allowed to cool down to a temperature (about 60°C) that can be handled by bare hands. Ethidium bromide was added and swirled to mix. The preparation was then poured into a cast tank with the comb making sure to remove the bubbles. This was left to set for about half an hour. The gel tank was filled with 0.5x TBE as the running buffer to a level that completely submerges the gel. Meanwhile, the samples were prepared from the PCR digest and loading dye. They were then loaded on to the prepared wells finishing off with a 1 Kb marker and immersed in running buffer.The gel tank was closed and power source turned on. Once the bands run all the way down, the unit was turned off and gel was removed from the tank. The gel was placed in a UV-transilluminator where the DNA bands can be viewed and photographed.
Protein Analysis
Root Plastid Isolation
10-15 grams of roots were washed with distilled water and chilled at 4oC for about 30 minutes. The roots were then homogenized in a blender with 40 ml of isolation buffer for 3-4 bursts of 6 seconds. The homogenate was filtered through 2 layers of miracloth with a pore size of 20 µm. This was then centrifuged at 1500g (4000rpm) for 2 minutes. The supernatant was discarded and the pellet was resuspended in 0.5 ml isolation buffer. Meanwhile, a centrifuge tube was prepared with 40 ml of 10 % percoll which was freshly prepared from stock and diluted with isolation buffer and BSA. The mixture was centrifuged at 3000g (7500rpm) for about 10 minutes. The pellet obtained was resuspended in 20 ml isolation buffer without BSA and centrifuged again at 1500g (4000 rpm) for 3 minutes. The pellet now obtained was resuspended in 0.5 ml isolation buffer (without BSA).
Concentration of Protein
The concentration of protein in the preparation was measured using Protein A280 in a Nanodrop Spectrophotometer. Protein A280 determines concentration of purified protein samples by relating absorbance with concentration with the help of Beer-Lambert equation51,
A = E * b * c
where, A = Absorbance value, E = Wavelength-dependent molar absorptivity coefficient, b = path length in centimeters, c = analyte concentration in moles/liter or molarity (M).
Latency of root plastids
The latency of root plastids was confirmed with the use of a phase contrast microscope. Root plastids or amyloplasts, since transparent cannot be viewed by a normal optical microscope42. Even though transparent bodies transmit as much light as the mounting medium that surrounds them, the refractive index varies slightly from the surrounding material and this is made use of in phase contrast microscopy43.The propagation of light through such an object provides a change in the optical path across the object, as well as a resulting shift in the phase of the light that has passed through the structure of interest relative to light passing around the structure. This phase-shift information can be used to form a visible image if it is converted into intensity variations that are detectable by the observer43. In a phase-contrast microscope, the phase difference between light that is diffracted by a specimen and light that is direct and undeflected is one-quarter of a wavelength or less. By placing an appropriate mask in the back focal plane of the objective to provide selective filtering of the diffracted light, the phase difference is increased by another quarter wavelength. Waves that differ in phase by half a wavelength cancel one another. In the phase image where this occurs, no light was transmitted. As a result, phase differences caused by variations in the specimen appear as intensity variations in the image43. A phase contrast microscope consists of 4 objective lenses, a centering telescope and a Zernike phase condenser lens. It has five settings that can be rotated through 10x, 20x, 40x, 100x and BF, where BF is "brightfield" with no phase. It was then aligned and centered before viewing. The height of the condenser has to be adjusted for optimum picture quality. The samples were prepared by smearing it onto a slide and then sealed.
SDS-polyacrylamide gel electrophoresis and Western Blotting
The components for separating and stacking buffer were mixed except TEMED and APS which were mixed just before casting. Seperating gel was casted first with a layer of butanol on top to save the gel from drying out and allowed to polymerize. Meanwhile, the samples were prepared in the ratio 2:1 with S×3, rested for about 30 minutes and incubated at 45°C for 7 minutes followed by resting for about 10 minutes. The butanol was rinsed away with de-ionised water, dried and the spacers were mounted and stacking gel was added. This was allowed to polymerize for about 30 minutes. The samples were loaded and gel was run at 15 mA/gel with cooling.
The electrodes were soaked in water, filter papers were cut and nylon membranes were prepared. They were wetted in methanol, rinsed in double distilled water and equilibrated in blotting buffer. After electrophoresis, the unit was detached and stacking gel discarded. The blotting sandwich was prepared placing the gel on the nylon membrane in between the filter papers. After making sure all air bubbles were removed, the membrane was blotted for about 75 minutes under a current of 0.8 mA/cm2. After transfer, the nylon membrane was washed in TBS×1 to remove blotchy or spotted background. The SNAP cassette was prepared with appropriate well blot holder. For this, the white membrane was wetted with double distilled (dd) water and the membrane was placed at the centre with the protein side down. Air bubbles were removed and squeezed to shut. To minimize non-specific binding, the membrane was blocked for 1 minute at room temperature. Then, it was incubated in 1.5 ml AB1 which were mixed under optimum dilution ratios. AB1 was removed and washed 3 times in 15 ml of TTBS×1 (to remove unbound AB1). Later, the membrane was incubated with 1.5 ml of AB2 for 10 minutes at room temperature. Following this, the membrane was removed from SNAP and transferred into TBS×1 (to remove residual tween). Meanwhile, the chemiluminescent substrate solution was prepared and incubated on membrane for 5 minutes at room temperature. Once this reaction was done, it was sealed in a heat sealable bag so as to prevent the membrane from drying out. This blot was then exposed to LAS-4000 mini at room temperature for time gaps ranging from 2 minutes to 10 minutes.
Functional Analysis
Pi Transport Assays
The samples were diluted to 1mg/ml, centrifuged for 1 minute at 13000 rpm and supernatant was removed. The pellet was re-suspended in 28.5µl corresponding buffer with 1µl of inhibitor or KH2PO4 (if needed) on ice. This was then transferred to room temperature in hot hood. 1.5µl of radioactive iP32 of final concentration 50µM and specific activity of 60µCi/µmol was added to the plastids and incubated for 1 minute at room temperature to effect the transport. The transfer was stopped by adding 170µl of cold buffer. It was centrifuged at 13000 rpm for 1 minute and supernatant was removed. As part of washing, the pellet was re-suspended in 200µl cold buffer and spun down. The supernatant was discarded again; 30µl of 2mM dodecyl maltoside (DM) was added on ice and then incubated for 5 minutes. Uptake with three inhibitors, 150µM Mersalyl, 6 mM pyridoxal-5'-phosphate (PLP) and 50µM Carbonyl cyanide p-[trifluoromethoxy]-phenyl-hydrazone (FCCP) were performed. They were then transferred to scintillation tubes with 1.5 ml dd water for counting in a scintillation counter machine. Back-exchange was done either in presence or absence of NaCl. Preloading was first done and washed two times. Later, they were incubated for exchange for 2-5 minutes. This was centrifuged and radioactivity was measured in both pellet and supernatant by using a scintillation counter as described above.
Responsible for this page:
Director of undergraduate studies Biology
Last updated:
05/20/09