
Bioinformatics
UniProt / Swiss-Prot predicts Anion transporter 3 (Locus name: At2g38060, Accession number = Q7XJR2) to be a transmembrane chloroplastic protein. ANTR3 gene is present on the 3rd chromosome of Arabidopsis with 8 exons. The At2g38060 gene52 as in Fig.5 codes for a protein with 512 amino acid residues with a 44 amino acid transit peptide so that the chain would be about 468 bases long(ExPASy). This is predicted to be a probable anion transporter belonging to the major facilitator super-family.
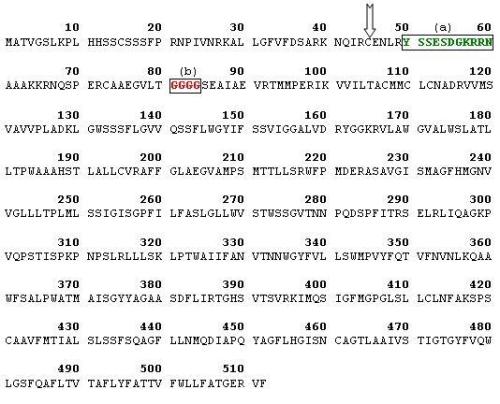
This protein under consideration has a poly-gly (GGGG) residue at position 81. TargetP predicted this protein to be found in the cytoplasm (green plastid) with a score of 0.905. MitoProt adumbrates export of the protein to the mitochondria with a probability of 0.8914 / 1 but cleavage sites could not be predicted. Predotar provides extra information about the localization of this protein and it was found with highest probability in plastids rather than in mitochondria and endoplasmic reticulum. According to PSORT, the certainty of finding the protein was highest in the endoplasmic reticulum with a score of 5 when compared to chloroplast and plasma membrane with scores 4 each. It has also identified some of its nearest neighbors; the closest being GR12_ARATH, an integral membrane protein found in plastids and another membrane protein found in endoplasmic reticulum, HMD 1_ARATH. ARAMEMNON predicted the protein to have 12 putative alpha helix transmembrane regions and concensus prediction localized it to chloroplast with a score of 18.3 against 1 for mitochondria and 0 for secretory pathways.
The average precursor molecular weight was computed to be 55306.68 Da and the theoretical isoelectric point was calculated as 9.71. ProtScale with the help of hydropathy plot of Kyle and Doolittle provides us an idea about the transmembrane property of the protein. The positive values indicate hydrophobicity and peaks below zero indicate hydrophilicity. The graph indicates majority of peaks above zero with a maximum of 2.678 and a minimum of -3.300. TMHMM calculates probability using hidden Markov models and according to the plot there were 10 predicted transmembrane helices. PROSITE and Pfam classified ANTR3 in Major facilitator superfamily (MFS) which are single-polypeptide secondary carriers capable only of transporting small solutes in response to chemi-osmotic ion gradients. InterPro predicted the protein to be a sodium-dependent phosphate transporter.
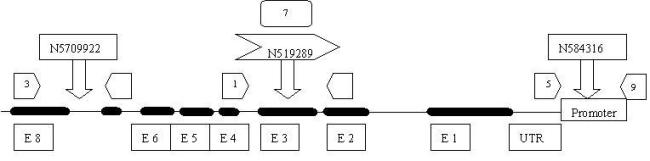
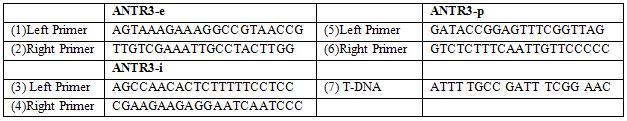
According to the data obtained from the above tools, a physical map was drawn with 8 mutants as depicted in figure 6. Three T-DNA mutations were identified in the At2g38060 gene; one on the intron (N5709922), exon (N519289), promoter (N584316) (table: 2).
Screening of mutants
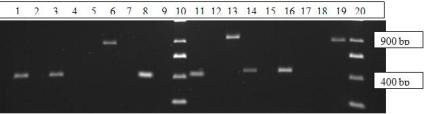
All plants were screened and homozygous ones were chosen out of the lot. In the gel shown below, (Fig. 7) two randomly selected plants of wild type Arabidopsis thaliana showed bands of 900 base pairs in wells with gene specific primers while mutants displayed bands around 400 base pairs in T- DNA specific primer wells. Since all the plants showed the expected bands, all 20 of them were homozygotes.
Phenotypic analysis
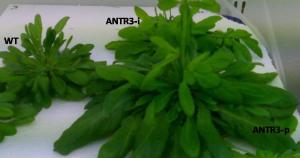
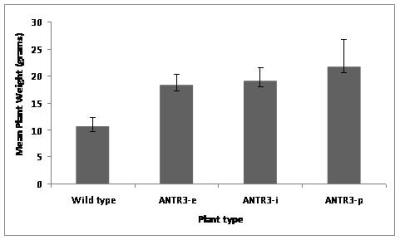
Four weeks old Arabidopsis wild-type and mutants were compared phenotypically and the mutants were found to grow more profusely than the wild-type as shown in fig.8. Mutants build-up 30 % more biomass than the wild-type when total amount of biomass was taken into consideration. A graph (Fig.9) has been plotted with mean plant weight against plant type which clearly illustrates the difference.
Protein analysis
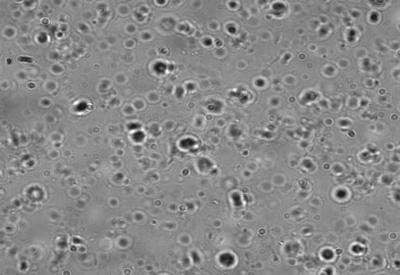
Phase contrast microscopy at 100 X magnification gives us an idea of the latency of root plastids. Even though they were isolated, frozen and thawed; majority of them were found to be intact as intact plastids look bright with a halo while broken ones look dark as seen in figure 10. A rough estimate of the total number of plastids in the field of view was counted and the percentage of intact plastids was about 70 %.
SDS-PAGE gel electrophoresis followed by Western Blotting was performed with an antibody raised against a peptide of ANTR3 protein on wild-type root plastid samples and bands were observed at a size of 45 KDa. Decreasing protein concentrations (15, 5 and 1.5 µg protein/lane) were loaded in wells and bands with decreasing intensity were observed as in figure 11. For the sake of controls, the second part of the gel loaded with the same protein concentrations are blotted against pre-immune in lanes 6-8. No bands were observed in these control wells as expected.
SDS-PAGE gel electrophoresis followed by Western Blotting was carried out with wild-type, all three mutants, and an ANTR1 mutant with concentrations 15 µg protein/lane against ab1 (antibody raised against a peptide of ANTR3 protein). Bands were observed at size 46 KDa for wild type, ANTR1 and ANTR3-e mutants. As expected no bands were observed again with pre-immune in lanes 6 to 8 (Fig. 12).
Functional analysis
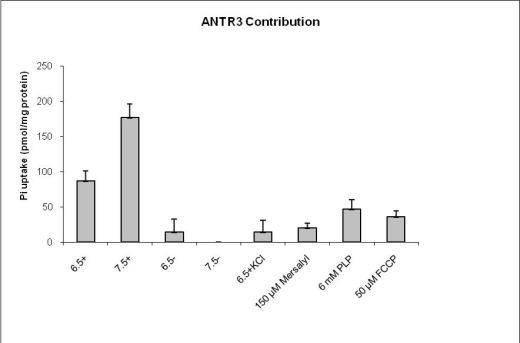
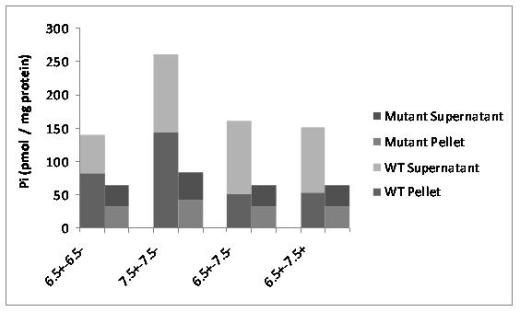
Transport experiments with wild-type Arabidopsis thaliana and the mutants have led to their functional characterization in-vivo. Figure 13 shows the uptake of radioactive Pi under different conditions of pH, cations and inhibitors. Non-specific binding was assayed at pH 6.5 and 7.5 with sodium cations (6.5+ and 7.5+) in presence of 10mM Pi and subtracted from individual values of the radioactive counter measurement values. Fig 14 shows the back-exchange experiments where radioactivity was counted in the supernatant and pellet.
Fig. 13 sums up the contribution of ANTR3 protein from experiments with all mutants.WT Arabidopsis show high values of transport activity and the lowest values for mutants under pH conditions of 7 .5 with Na+. It was found that all three inhibitors Mersalyl, PLP and FCCP have pronounced effect on transport of 32Pi. The most efficient was PLP (18 % left) followed by Mersalyl (35 %) and FCCP (35 %). Back exchange experiment was performed with pre-loading and exchange. The amount of radioactivity was measured in both the pellet and supernatant and the highest rate of export was observed in 6.5+ Na+ - 7.5- Na+. These values were expressed in ratios and a graph was plotted as in figure 14.
Back exchange performed with the same pH of 6.5+ Na to 6.5+ Na, displayed the same ratios of 2:1 in both wild-types and mutants but to a lesser extend compared to wild-type (data not shown).
Responsible for this page:
Director of undergraduate studies Biology
Last updated:
05/20/09