
Results from the GLM
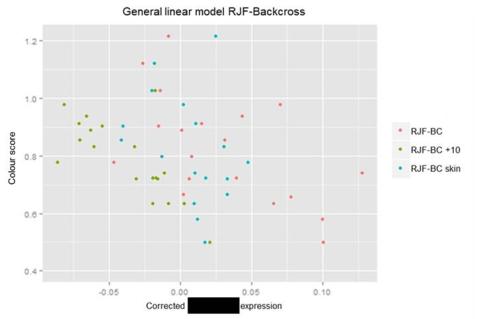
During the project we found that the quality of the RNA samples were inreasing by each batch, the reason for this is most likely that my technique improved. Since the quality and the amount of degradation might be the cause of different expression levels between samples, a General linear model was used to minimize this problem. The RNA Integrity Number for each sample from the three RJF-Backcross experiments were used as a covariates, and the residuals from the model was used when correlating relative expression with the colour score.
- The reults from this model strengthened the positive correlation, which indicates that the quality differences were not the main factor causing the differential expression.
- The p-value for the model is 1.962e -07, an adjusted R2 value of 0.3915 and an F-value of 35.74 with 53 degrees of freedom.
Responsible for this page:
Director of undergraduate studies Biology
Last updated:
05/27/14