
Treatments
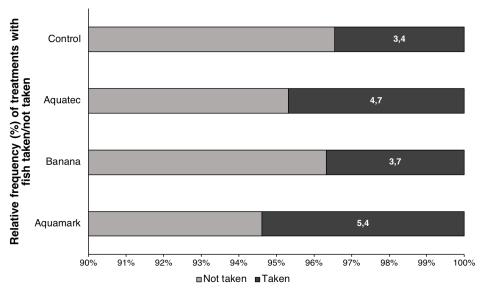
No significant difference was found between the frequencies fish were taken from the different treatments (Aquamark, Banana, Aquatec, and Control) (Fisher's exact test; p > 0.05). Nonetheless, it is relevant to note that only 4.2% of 572 stations serviced had fish taken. From these 9 stations contained Aquamark100 pingers, 4 contained Banana pingers, 3 contained Aquatec 2446 pingers, and 8 were control treatments (no pinger) (Fig 6).
Time of year
The month of the year had no effect on the frequency of stations with fish taken in total for all treatments (χ2(3) = 7.117; p > 0.05).
Other variables
Location of the stations and water depth were analyzed in relation to the frequency of stations that presented fish taken. On average each station was serviced 28 times. No significant differences in frequency of treatments with fish taken were found between the twenty positions (χ2(19) = 20.935; p > 0.05).
Furthermore, the depth at which the stations were deployed at (ranging from 11 to 18 m) did not have a significant influence on whether fish were taken or not (χ2(6) = 3.400; p > 0.05).
Responsible for this page:
Director of undergraduate studies Biology
Last updated:
06/06/18