
A total of 2251 individual carabid from 51 species were collected during the four sampling occasions. The ten most common species represented 85.2% of the total individuals collected (Appendix 2). Composition of the ten most common species varied in each sampling time (Appendix 3), with Poecilus versicolor dominating in the first and second sampling while Pterostichus melanarius and Pterostichus niger where the most abundant in the last two times. The three most diverse genera were Amara (twelve species), Pterostichus (eight species) and Bembidion (five species). Eleven species occurred as singletons, and generally, the genera we studied where found to have few species.
Carabids association with time, grass height and canopy cover
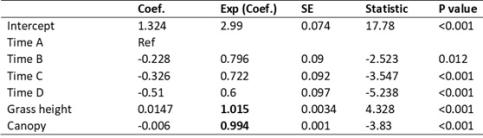
With reference to table 1, for easier interpretation, we used exponentiated coefficients (Exp Coef.). So, we say the expected count of species increased by 1.5% for each one-unit increase in grass height holding other variables constant, while expected number of species decreased by 0.6% for each one-unit increase in canopy cover percentage, holding other variables constant. Number of species was lower at every successive time. Model assessment through residuals plot indicated that the model was a good fit for the data.
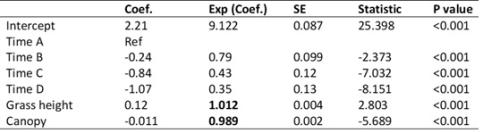
With reference to table 2, the expected count of species increased by 1.2% for each one-unit increase in grass height holding other variables constant, while expected number of species decreased by 1.1% for each one-unit increase in canopy cover percentage, holding other variables constant. Abundance was lower at every successive time. Model assessment through residuals plot indicated that the model was a good fit for the data.
Beetle diversity
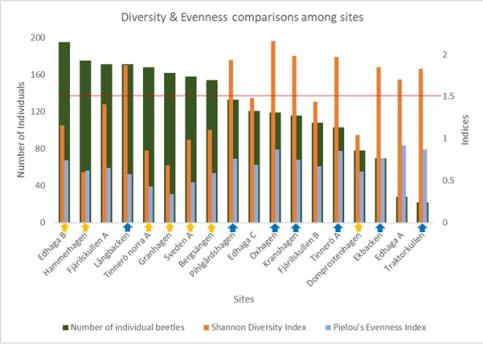
Fig. 3 shows that, generally, H’ and J’ were found to be considerably higher in lightly grazed sites (blue arrows), than in more intensely grazed sites (yellow arrows). No clear pattern was indicated by canopy cover in this analysis, but overall, sites with both low grazing and low canopy cover were most diverse. Most sites in which low grazing intensity took place had a Shannon’s diversity above 1.5, within a common range of 1.5 and 3.5, as determined by past studies, e.g. Magurran (2004).
Site species variation
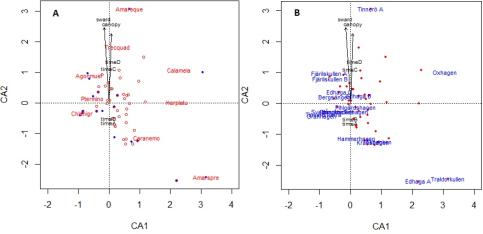
Figure 4. The species assemblage was significantly associated with time, canopy cover and grass height, explaining 52% of the total variation in species composition. When environmental variables are added, plot A shows the amount of effect each variable had on the different species. E.g. Amara equestris was more sensitive to changes in canopy cover and grass height than any other species.
Since environmental factors mainly point along CA2, and not CA1, the dominating gradient of variation in species composition is hard to interpret. However, sites was also a major factor that structured species occurrence. We can see in fig. 4A, the association between species and sites, for example, Calathus melanocephalus preferred or was most probably found in Oxhagen. Regardless, time explained the most variability (35.91%) in species occurrence, while not much difference was found between Canopy cover and Grass height.
Responsible for this page:
Director of undergraduate studies Biology
Last updated:
06/04/18