
Results
Results are organised into the separate network metrics, which are further split into geographical and environmental variables for each network type. Lastly follows an unweighted summary table, which also excludes factor interactions.
Generality distributions
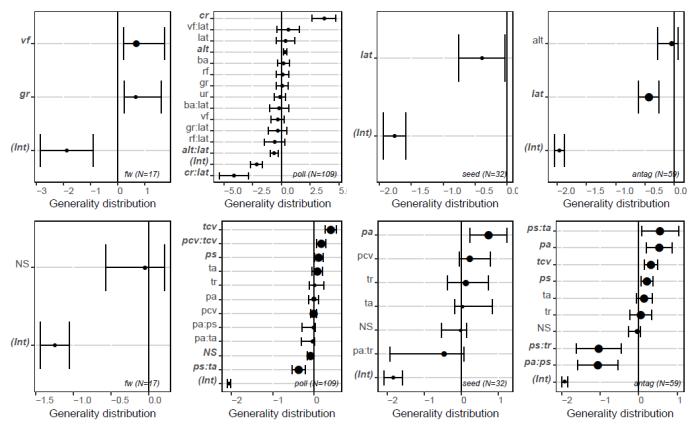
For both generality and vulnerability distributions, a high value means that the degree of specialisation differs a lot between species in the network. Lower values indicate more similar degrees of specialisation of species in the networks. Generality distribution in all networks ranged from 0.083 to 0.61, with a mean of 0.17.
For geographical variables (Figure 1, top row) in food webs, varied forest and grassland land covers significantly increased generality distribution. Croplands, and to a smaller extent altitude, significantly decreased pollination network generality distribution. For the same networks, interactions between altitude and latitude, and interaction between croplands and latitude significantly narrowed generality distributions. For both seed dispersal and antagonistic networks, latitude significantly decreased generality distributions.
No environmental variables (Figure 1, bottom row) significantly affected generality distributions in food webs. In pollination networks, precipitation seasonality, temperature change velocity, as well as the interaction between temperature and precipitation change velocities significantly increased generality distributions. Also for pollination networks, interactions between precipitation seasonality and temperature average, and to a smaller extent number of species, significantly lowered generality distributions. Precipitation average significantly widened generality distributions in seed dispersal networks. In antagonistic webs, precipitation average and seasonality, temperature change velocity, as well as the interaction between precipitation seasonality and temperature average significantly widened generality distributions. Interaction between precipitation seasonality and temperature range, and interaction between precipitation average and precipitation seasonality, significantly narrowed generality distributions.
Vulnerability distributions
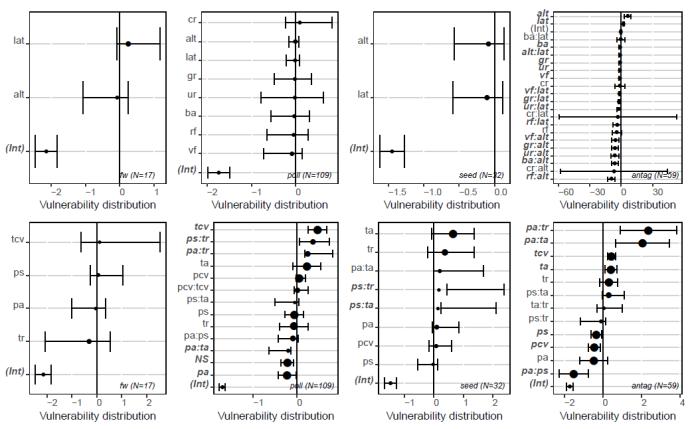
Vulnerability distribution in all networks ranged from 0.040 to 0.69, with a mean of 0.19. No geographical variables (Figure 2, top row) significantly affected vulnerability distributions in either food webs, pollination networks or seed dispersal networks. In antagonistic webs, both altitude and to a smaller extent latitude, increased vulnerability distributions. For the same network type, many land cover types, both by themselves and in interactions with either latitude or altitude, significantly decreased vulnerability distributions.
Environmental variables (Figure 2, bottom row) did not significantly affect vulnerability distributions in food webs. For pollination networks, temperature change velocity, and interactions between temperature range both precipitation average and seasonality, significantly increased vulnerability distributions. Precipitation average, number of species and interaction between precipitation average and temperature average significantly narrowed pollination network vulnerability distributions. In seed dispersal networks, interactions between precipitation seasonality and both temperature average and range significantly widened vulnerability distribution. However, their relative importances for the average model were both low. Antagonistic network vulnerability distributions were significantly increased by mainly interactions between precipitation average and both temperature range and average, but also to a smaller extent by temperature change velocity and temperature average. For the same network type, precipitation change velocity, precipitation seasonality, and well as the interaction between precipitation average and seasonality significantly lowered vulnerability distribution.
Intervality of predators
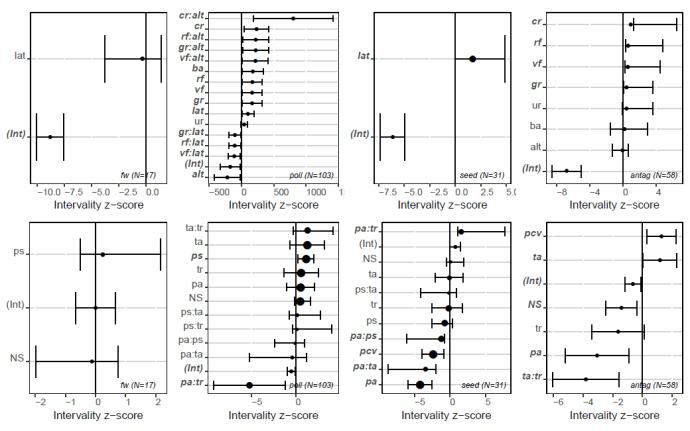
The z-score for intervality of predators ranged from -1.62 to -21.97, with a mean of -7.22. A more negative z-score means higher intervality, being closer to interval (fewer gaps).
Intervality from a predator perspective (Figure 3) in food webs was not significantly affected by either geographical or environmental variables. Looking at pollination networks, multiple land cover types, absolute latitude, and interactions between altitude and several land cover types all significantly decreased intervality. Altitude by itself, as well as latitude interactions with grasslands or all forest types made the networks significantly more interval. In seed dispersal networks, of the geographical variables, only latitude significantly affected predator intervality, where longer distances to the equator significantly decreased intervality. For antagonistic networks, neither latitude or altitude significantly affected intervality.
Moving on to environmental variables (Figure 3, bottom row), none significantly affected food web intervality of predators. Precipitation seasonality significantly decreased pollination network intervality. The interaction between precipitation average and temperature range made pollination network significantly more interval. Opposite to pollination networks, in seed dispersal networks, interaction between precipitation average and temperature range significantly decreased intervality. Precipitation average and its interactions with precipitation seasonality and temperature average, as well as precipitation change velocity made seed dispersal networks significantly more interval. In antagonistic networks, temperature average and precipitation change velocity significantly decreased predator intervality. More species, higher precipitation average and the interaction between temperature average and range made antagonistic networks significantly more interval.
Intervality of prey
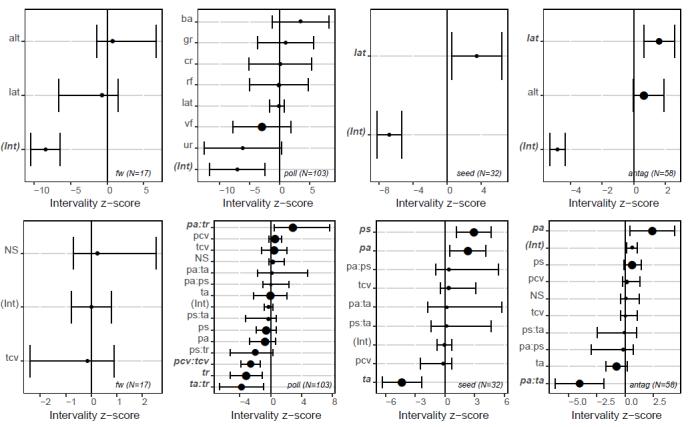
Z-score for intervality of prey ranged from -1.87 to -21.42 with a mean of -6.49. No geographical or environmental variables significantly affected intervality of prey in food webs. The same applied for geographical variables in pollination networks. However, in seed dispersal as well as antagonistic networks, absolute latitude significantly decreased prey intervality (Figure 4, top row).
For pollination networks, interaction between precipitation average and temperature range significantly decreased intervality (Figure 4, bottom row). For the same networks, temperature range, interactions between precipitation and temperature change velocities, and interactions between temperature average and range, significantly increased intervality. In seed dispersal networks, precipitation average and seasonality significantly decreased intervality, while temperature average significantly increased it. In antagonistic webs, precipitation average significantly decreased intervality, while interactions between precipitation average and temperature average significantly increased intervality.
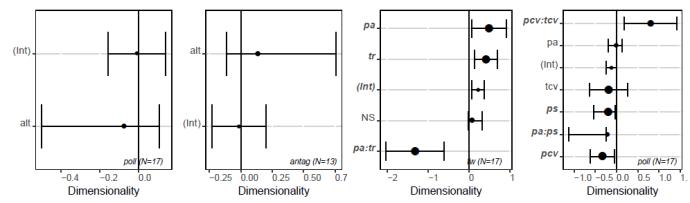
Dimensionality
In the selected networks, dimensionality ranged from 1 to 6 with a median dimensionality of 2. No geographical models for food webs and seed dispersal networks fulfilled the model selection requirement, and were thus omitted. For pollination and antagonistic networks, no significant geographical patterns were observed (Figure 5, first two plots).
Similarly for environmental models (Figure 5, last two plots), no antagonistic and seed dispersal network models fulfilled the requirements, and were omitted. For food webs, higher precipitation average and temperature range significantly increased dimensionality by themselves. However, when interacting, the same factors significantly decreased dimensionality. For pollination networks, the interaction between the temperature and precipitation change velocities significantly increased the number of dimensions. Precipitation change velocity by itself, as well as precipitation seasonality and the interaction between precipitation average and seasonality, significantly decreased dimensionality.
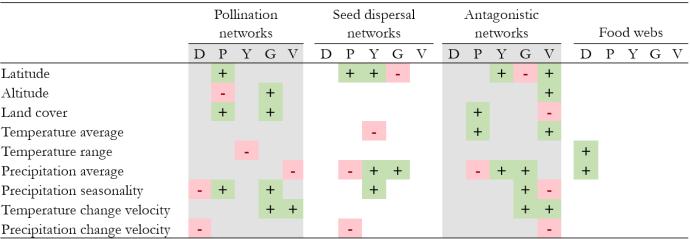
Summary
All network types except food webs were significantly affected by at least some geographical and environmental variables, though the type of affected response variable varied (Table 1). Food webs were only significantly affected by temperature range and precipitation average for dimensionality measurements.
Responsible for this page:
Director of undergraduate studies Biology
Last updated:
05/22/18