
General Behaviour Assessment (GB)
To evaluate the subjects’ position in the enclosure during a normal day at the shelter, a video camera was placed in front of the dog’s enclosure (figure 5A), recording for ten minutes. As summarized in figure 5B, the recordings were analysed using 1-minute instantaneous focal sampling method, attributing a score of 3 if the dog was at the front of the enclosure, a 2 if it was in the middle and a 1 if the dog was at the back of its enclosure. The count of scans for each position was divided by the count of the total scans, resulting in a percentage of scans.

Results
Position in the Enclosure during the general behaviour Assessments
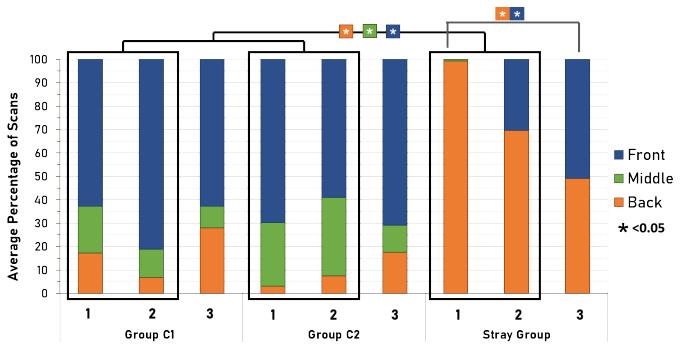
Figure 6 shows the average percentage of scans in the different positions in the enclosure (back, middle, front) at time points 1 (GB1), 2 (GB2) and 3 (GB3) for the three groups.
Group Comparisons - Independent-Samples Kruskal-Wallis Test
- The Stray Group had a significantly higher percentage of scans for the back position in the enclosure than the control groups (GB1: H(2)= 11.664, p= 0,003, GB2: (H(2)=12.448, p= 0,002).
- The controls groups had a significantly higher percentage of scans for the middle and front position than the Stray Group (middle: GB1, H(2)=6.113, p=0,047, GB2, (H(2)=7.758, p= 0,021; front: GB1 (H(2)=11.376, p=0.003) and GB2 (H(2)= 6.465, p= 0.039).
- No significant differences were found between the groups for last general behaviour assessment, the Stray Group was observed to be at front of their enclosure or any other position just as much as the control groups.
Intragroup comparisons - Related-Samples Friendman's Test (post hoc: Dunn Bonferroni)
- No significant were found differences for both Group C1 and C2.
- There were significant differences found for the Stray Group, more specifically between GB3 and GB1 for the front (p=0.042 and back (p=0.042) positions.
Responsible for this page:
Director of undergraduate studies Biology
Last updated:
06/01/20