
Sociability Test (ST)
Immediately after recording for the General Behaviour Assessment, a Sociability Test (ST) was performed to assess the sociability of the dogs towards humans. This test corresponds to a component of the original Temperament Test developed by Valsecchi et al. (2011) with the exception of the Handling subtest.
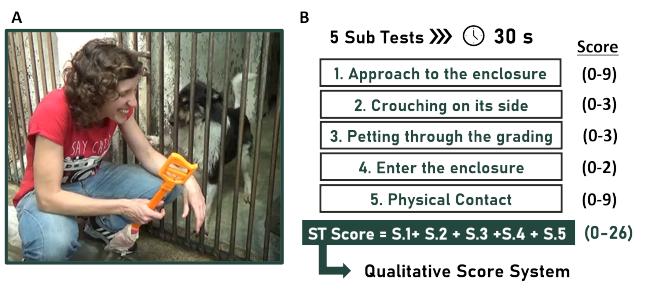
The ST is summarized in figure 7, the test comprised five subtests, lasting 30 seconds each, during which an experimenter performed a series of predetermined actions designed to assess the sociability of the animals. The test began with the experimenter standing in front of the subject’s enclosure (Subtest 1), then lowering her stance (Subtest 2), trying to pet the dog through the grading (Subtest 3), entering the dog’s enclosure and staying still (Subtest 4) and finally trying to pet the dogs (Subtest 5). Each subtest had a partial score than was then added to a total score ranging from 0 to 26, 0 being the lowest and 26 being the highest corresponding to a very social dog.
Results
Total score given for the Sociability Tests
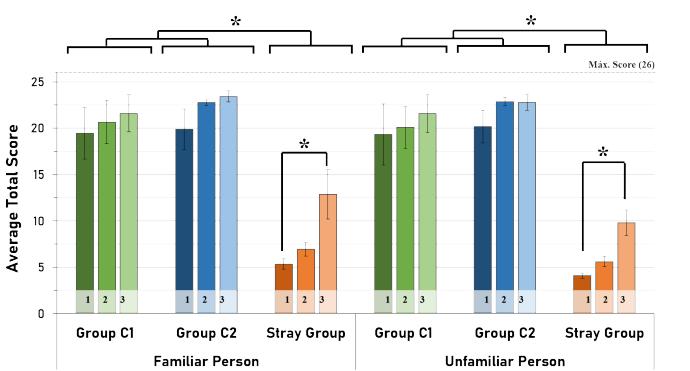
In Figure 8, we can see the representation of the average total ST score for each group at time points 1 (ST1), 2 (ST2) and 3 (ST3) for the three groups.
Group Comparisons: Independent-Samples Kruskal-Wallis Test
- Significant differences were found in the total scores for all three time points for both familiar (ST1: H(2)=10.149, p=0.006; ST2: H(2)=11.000, p=0.004; ST3: H(2)=9.719, p=0.008) and unfamiliar person (ST1: H(2)=9.475, p=0.009; ST2: H(2)=11.359, p=0.003; ST3: H(2)=11.017, p=0.004).
- The Stray Group had significantly lower scores than the control groups across time points for both familiar and unfamiliar person.
Intragroup Comparisons: Related-Samples Friedman's Test (post hoc - Dunn Bonferroni)
- The stray group had significantly higher scores across time points, especially between ST1 and ST3 for both familiar (p=0.004)and unfamiliar person (p=0.005)-
Familiar Person vs Unfamiliar Person: Wilcoxon's Test with Bonferroni Correction
- No significant differences were found when comparing the familiar and unfamiliar person.
Responsible for this page:
Director of undergraduate studies Biology
Last updated:
06/02/20