
Least Test (LT)
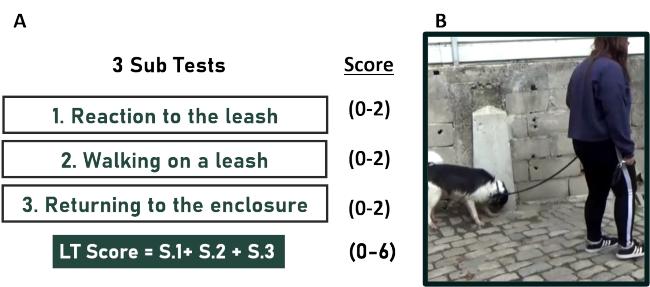
Similarly, to the ST, the Docility to Leash Test (LT) is a component of the Temperament Test developed by Valsecchi et al. (2011). This component aims to evaluate how docile the dogs are in the event of using a leash and walking with it. The LT comprised three subtests during which an experimenter performed a series of pre-determined actions designed to assess the behaviour of the animals during a walk with a leash. The test began with the experimenter holding the leash next to the dog during 30 seconds and afterwards putting it on (Subtest 1), then walking the dog towards the test area (Subtest 2, see Figure 1), and finally returning to the enclosure (Subtest 3). If the dog showed intense fear when the experimenter tried to put the leash on, the test was considered terminated at that stage, to avoid stressing the animal any further. All instances of the LT were recorded using a video camera that was held by a second experimenter, who positioned herself in order to interfere the least possible on the test.
Each subtest had a partial score that was then added to a total score ranging from 0 to 6, 0 being the lowest and 6 being the highest, corresponding to a dog that is very used to walking on a leash.
Results
Total Score given for the leash test
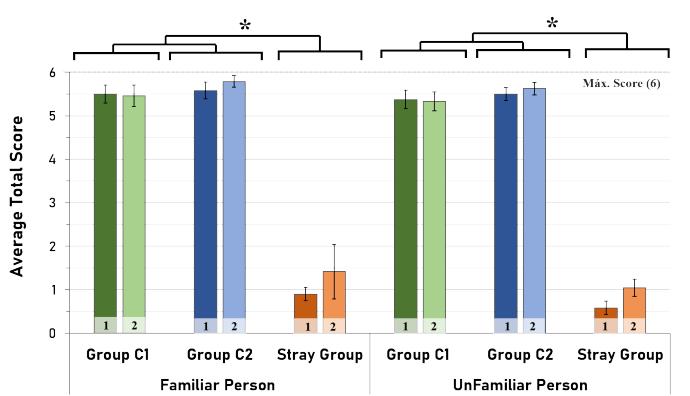
In Figure 10, we can see the representation of the average total LT score for each group at time points 1 (LT1) and 2 (LT2) for the three groups.
Group Comparisons Independent-Samples Kruskal-Wallis Test
- Significant differences were found in the total scores for all time points for both familiar (LT1: H(2)=10.612, p=0.005; LT2: H(2)=12.100, p=0.002) and unfamiliar person (LT1: H(2)=11.609, p=0.003; ST2: H(2)=12.013, p=0.002).
- The Stray Group had significantly lower scores than the control groups across time points for both familiar and unfamiliar person.
Intragroup comparisons - Related-Samples Friedman's Test
- No significant differences were found within the study groups at any given time point for both familiar and unfamiliar person,
Familiar Person vs Unfamiliar Person - Wilcoxon's Test with Bonferroni Correction
- No significant differences were found when comparing familiar and unfamiliar person.
Responsible for this page:
Director of undergraduate studies Biology
Last updated:
06/02/20