
Results
Comparing feral and White Leghorn chickens
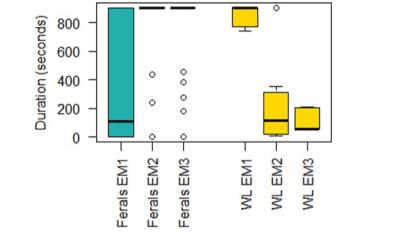
Emergence test
Three emergene tests were performed, in which domesticated and feral populations differed significantly in each seperate test (p < 0.05). The first emergence test was very different from the subsequent other two, and the emergence tests show reverse patterns for domesticated and feral chickens. Whereas the White Leghorn had a long emergence latency in the first test, this latency was longer in the two subsequent ones. The opposite is true for the feral chickens. Feral chickens also showed a lot more variation compared to the domesticated White Leghorn in the first emergence test. We therefore cannot really conclude if the feral chickens were more fearful in this test.
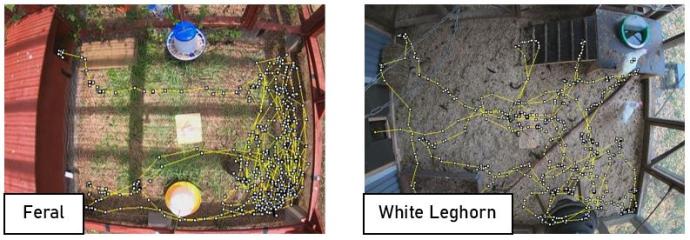
Open Field
Feral chickens spent a mean of 13.01 ± 1.9 % of the time in the middle zone, which is significantly less (p < 0.001) than the 36.90 ± 5.2 % that White Leghorn spent in this middle zone.
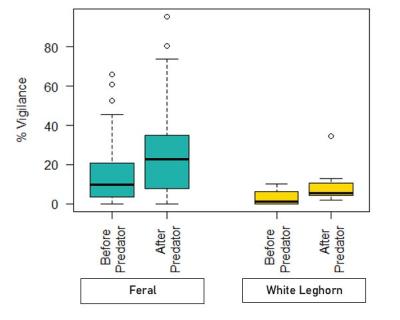
Predator Model
Compared to the five minutes before, the feral chickens showed increased vigilance the five minutes after the predator model was shown. This increase was not observed in White Leghorn chickens. However, other parameters measuring predator response, such as decreased time spent in the middle, decreased movement or increased alarm calling were, however, not observed in either population.
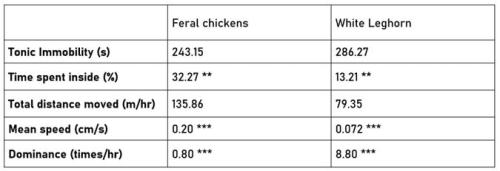
Other behavioural measures
The table below shows some other interesting results regarding fear-related behaviours. Important to note that tonic immobility durations did not differ between feral and domesticated chickens. The results of the novel object test are excluded here as interest in it was very low in both populations, and therefore hard to compare or draw conclusions from.
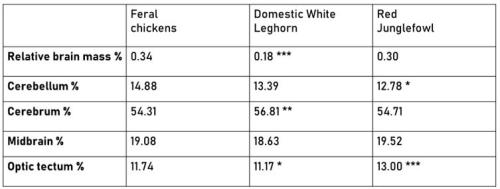
Brain composition
Comparing brain composition for feral chickens with not only domesticated White Leghorn, but also with captive Red Junglefowl (measures taken from another study6) showed some interesting results. Despite more similarities with Red Jungefowl, brain composition of feral chickens still differs from both populations (see the table below for details).
Correlating measures
Little to no significant correlations were found between behavioural measures. However, some interesting associations between behavioural measures and brain composition were observed.
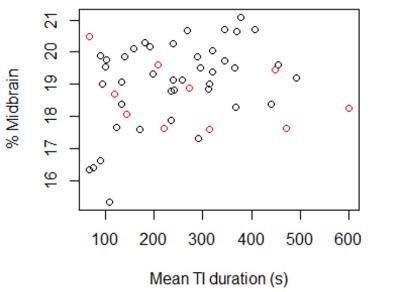
For example, a significant positive correlation was found between the duration of Tonic Immobility and the Proportionate Midbrain Mass in feral chickens (rho = 0.370, p = 0.017*) but not in White Leghorn (rho = -0.394, p = 0.260).
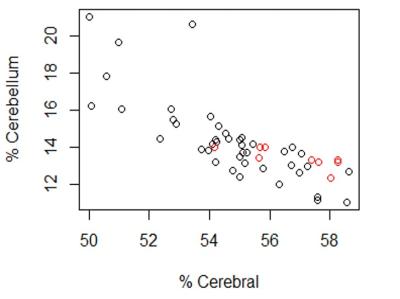
A strong negative correlation was also found between the Proportionate Cerebellum and Cerebrum Mass, for both feral (rho = -0.84, p < 0.001***) and White Leghorn chickens (rho = -0.65, p = 0.043*).
Responsible for this page:
Director of undergraduate studies Biology
Last updated:
05/25/20