
Materials & Methods
Determination of taste preference thresholds
Taste stimuli
Acesulfame K: An artificial, high-potency, and non-caloric sweetener perceived by humans as about 200 times sweeter than sucrose. Reported to have a bitter-side taste at high concentrations.
Alitame: An artificial, high-potency and non-caloric sweetener perceived by humans as about 2,000 times sweeter than sucrose.
Aspartame: An artificial, high-potency and non-caloric sweetener perceived by humans as about 200 times sweeter than sucrose. Reported to have a bitter side taste at high concentrations.
Isomalt: An artificial, low-potency, and nutritive sweetener perceived by humans as about 45% as sweet as sucrose.
Sodium cyclamate: An artificial high-potency sweetener perceived by humans as about 30-50 times sweeter than sucrose. Reported to have a sour side taste at high concentrations.
Sodium saccharine: An artificial, high-potency and non-caloric sweetener perceived by humans as about 300-400 times sweeter than sucrose. Reported to have a bitter side taste at high concentrations.
Monellin: A naturally occurring high-potency sweetener perceived by humans as about 800-2,000 times sweeter than sucrose. Chemically a protein found in the West African serendipity berry (Dioscoreophyllum cumminsii).
Thaumatin: A naturally occurring high-potency sweetener perceived by humans as about 2,000 times sweeter than sucrose. Chemically a protein found in the West African katemfe fruit (Thaumatococcus daniellii).
Galactose: A naturally occurring low-potency sweetener perceived by humans as about 30% as sweet as sucrose.
Sorbitol: A naturally occurring, low-potency, and nutritive sweetener perceived by humans as about 60% as sweet as sucrose.
Experimental procedure
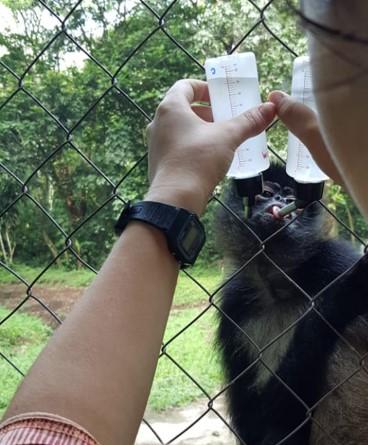
Two-bottle preference tests (Figure 1) of short duration were performed to determine the taste preference thresholds of four adult spider monkeys to the different sweeteners. The animals were simultaneously presented with two 100 mL graduated plastic cylinders with metal drinking spouts, one containing tap water and the other containing an aqueous solution of the taste stimulus at a defined concentration. The individuals were allowed to drink from the bottles for 1 minute. After each trial, the amount of liquid consumed from each bottle was recorded.
Data analysis
An individual was considered to have preferred the sweet-tasting substance over water if:
- the percentage of consumed sweet-tasting solution was at least 66.7% of the total liquid consumed
- the individual consumed more of the sweet-tasting solution than water in at least 8 out of 10 trials (p < 0.05, binomial test)
The taste preference threshold for each substance was considered as the lowest concentration significantly preferred over water by each individual.
Analysis of taste-induced facial responses
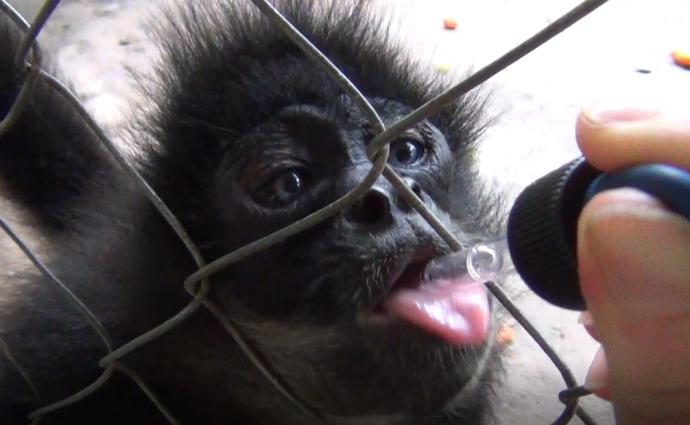
6 adult spider monkeys were presented with different taste stimuli using a glass dropper (Figure 2). Sucrose was used as a sweet taste stimulus, caffeine was used as a bitter taste stimulus and citric acid was used as a sour taste stimulus. Tap water was used as a neutral stimulus and thus, a control. The fifth stimulus, aspartame, was included as a means to better understand the monkey’s perception of the substance and thus the results of the previously conducted two-bottle preference tests.
The monkeys' facial responses to the different substances were video-recorded and analyzed by two independent coders according to an ethogram compiling a series of relevant behaviors.
As a preliminary validation of the data and in order to verify a sufficient level of agreement between the two coders’ independent analysis of the video footage, an Intraclass Correlation Analysis (ICC) was run. In order for the data to be considered reliable and included in the study, a correlation coefficient (α) of at least 0.7 was necessary.
The data points which achieved sufficient inter-rater agreement were further analyzed for significant differences in facial responses between the different tested substances. This was done by performing a Kruskal-Wallis test for each one of the selected behaviors at the group level, pulling all individuals together.
Responsible for this page:
Director of undergraduate studies Biology
Last updated:
05/25/20