
Results
Determination of taste preference thresholds
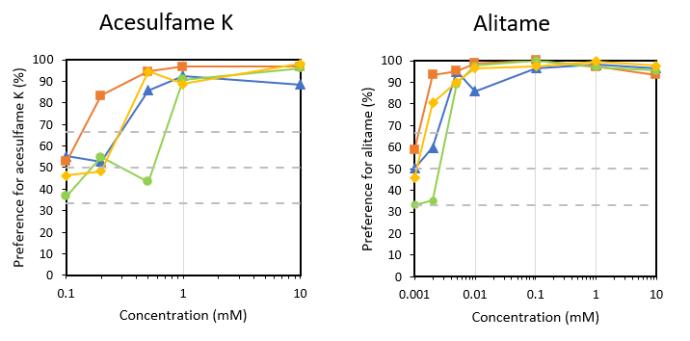
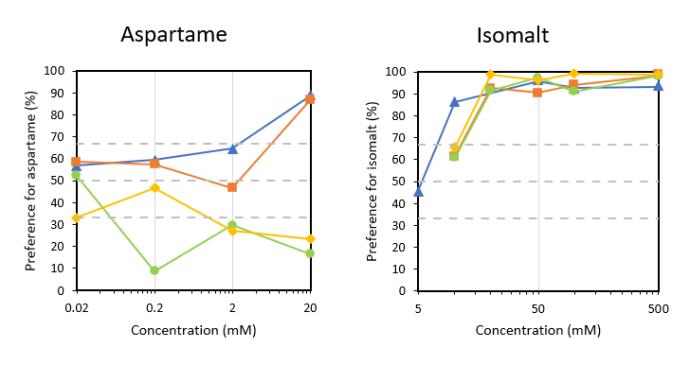
Artificial sweeteners
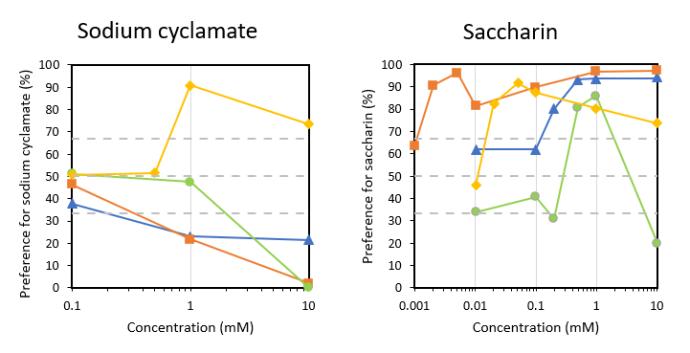
For acesulfame K the four spider monkeys displayed taste preference thresholds between 0.2 mM and 1 mM. The taste preference threshold was 0.2 mM for Lucas, 0.5 mM for Cejitas and Mari, and 1mM for Gruñon (p<0.05, binomial test) (Figure 3). The taste preference thresholds for alitame ranged from 0.002 mM to 0.005 mM. Lucas and Cejitas displayed a taste preference threshold of 0.002 mM and Mari and Gruñon displayed a taste preference threshold of 0.005 mM (p<0.05, binomial test) (Figure 3). The taste preference threshold for aspartame was 20 mM for Lucas and Mari (p<0.05, binomial test) (Figure 3). Cejitas and Gruñon did not show a preference for this substance at any of the concentrations tested. Rather, Cejitas rejected the concentrations 20, 2 and 0,02 mM, and Gruñon rejected the concentrations 20, 2 and 0,2 mM. For isomalt, the taste preference threshold was 10 mM for Mari and 20 mM for Cejitas, Gruñon and Lucas (p<0.05, binomial test) (Figure 3). The taste preference threshold for sodium cyclamate was 1 mM for Cejitas (p<0.05, binomial test) (Figure 3). None of the three remaining individuals displayed a preference for this substance at any of the concentrations tested. Rather, Mari and Lucas rejected the substance at the concentrations 10 and 1 mM, and Gruñon rejected the substance at the concentration 10 mM. For sodium saccharine, the taste preference thresholds ranged from 0.002 mM to 0.5 mM. The taste preference thresholds for this substance were 0.002 mM for Lucas, 0.02 mM for Cejitas, 0.2 mM for Mari and 0.5 mM for Gruñon (p<0.05, binomial test) (Figure 3).
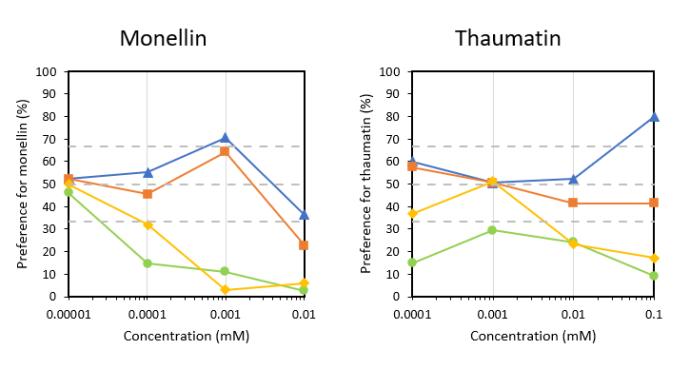
Sweet-tasting proteins
For monellin, the taste preference threshold was 0.001 mM for Mari (p<0.05, binomial test) (Figure 4). None of the other individuals showed a preference for this substance. Cejitas and Gruñon displayed a rejection for the substance at the concentrations 0.01, 0.001 and 0.0001 mM, and Lucas displayed a rejection at 0.01 and 0.001 mM. For thaumatin, only Mari displayed a preference, with a taste preference threshold of 0.1 mM (p<0.05, binomial test) (Figure 4). Cejitas rejected the concentrations 0.1 and 0.01 mM, and Gruñon rejected 0.1, 0.01, 0.001 and 0.0001 mM. Lucas did not display a preference for thaumatin nor rejected the substance.
Sweet-tasting saccharides
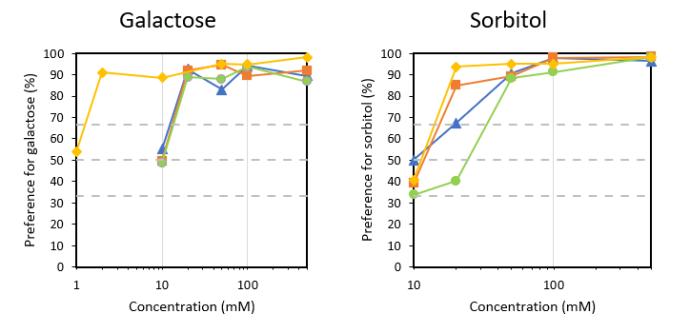
The taste preference thresholds for galactose ranged between 2 mM and 20 mM in the group of spider monkeys. The taste preference threshold was 2 mM for Cejitas and 20 mM for Gruñon, Lucas and Mari (p<0.05, binomial test) (Figure 5). For sorbitol, the taste preference thresholds were 20 mM for Cejitas, Lucas and Mari, and 50 mM for Gruñon (p<0.05, binomial test) (Figure 5).
Analysis of taste-induced facial responses
10 recorded facial responses differed significantly between the different taste substances.
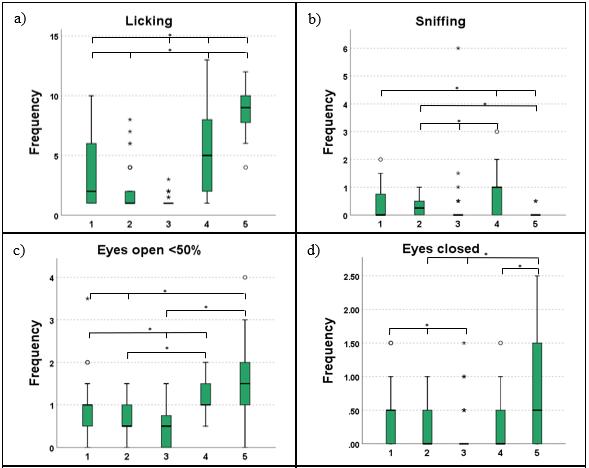
Licking occurred significantly more often during sucrose, control, and aspartame trials compared to caffeine and citric acid trials (p < 0.001, Kruskal-Wallis). Sucking frequency was significantly higher during sucrose trials than during trials of any other substance (p < 0.01, Kruskal-Wallis ) . Regarding sniffing frequency, all substances differed significantly from each other (p < 0.001, Kruskal-Wallis) with the exception of the pairwise comparisons between sucrose and citric acid, and aspartame and caffeine.
Frequencies of eyes open less than 50% differed significantly between all substances (p < 0.001, Kruskal-Wallis) with the exception of the pairwise combinations between caffeine and citric acid and tap water and sucrose. In general, eyes were open less than 50% the most during sucrose and control ingestions. The frequency of closed eyes differed significantly between aspartame and citric acid, sucrose and caffeine, sucrose and citric acid, and sucrose and tap water (p < 0.05, Kruskal-Wallis).
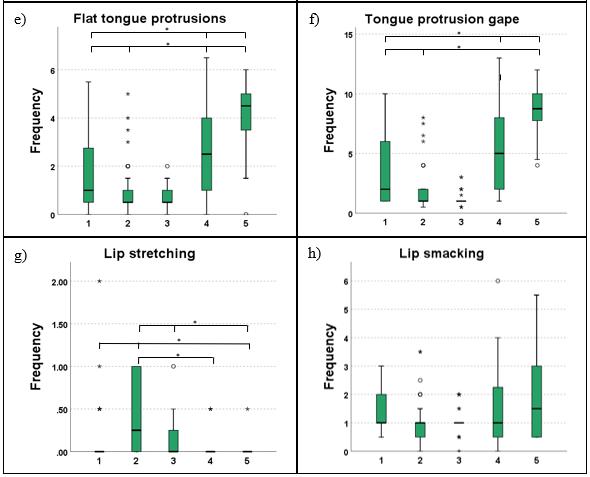
The frequency of flat tongue protrusions differed significantly between all substances (p < 0.001, Kruskal-Wallis), with the exception of the pairwise comparison between caffeine and citric acid. In general, flat tongue protruding occurred the most during sucrose ingestions, followed by control and then aspartame ingestions. The frequency of tongue protrusion gape differed significantly between all tested substances (p < 0.001, Kruskal-Wallis), with the exception of the pairwise comparison between caffeine and citric acid. In general, tongue protrusion gapes occurred the most during sucrose ingestions, followed by control and then aspartame ingestions.
The frequency of lip stretching differed significantly between all substances (p < 0.001, Kruskal-Wallis), with the exceptions of the pairwise comparisons between aspartame and citric acid, aspartame and tap water, citric acid and tap water, and sucrose and tap water. In general, lip stretching occurred the most during caffeine ingestions, followed by citric acid ingestions. Although no significant difference in the frequency of lip-smacking was found between substances, a trend was identified (p = 0.065, Kruskal-Wallis). In general, lip-smacking occurred most often during sucrose trials, followed by control trials and then aspartame trials.
Regarding withdrawals from the dropper, frequencies differed significantly between all tested substances (p = 0.0, Kruskal-Wallis), with the exception of the pairwise comparison between caffeine and citric. In general, monkeys withdrew from dropper most often during citric acid, caffeine and aspartame trials, and withdrew the least during sucrose and control trials.
Responsible for this page:
Director of undergraduate studies Biology
Last updated:
05/25/20