
Material & Methods:
Animals
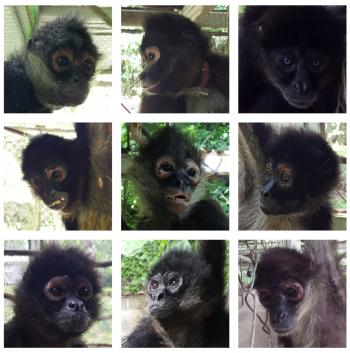
The study was carried out with nine adult black-handed spider monkeys (Ateles geoffroyi), who were tested individually. The animals were housed at the field station UMA Doña Hilda Ávila de O’Farrill of the Universidad Veracruzana, located in a nature reserve near Catemaco, in the state of Veracruz, Mexico.
Experiment 1 - Object permanence
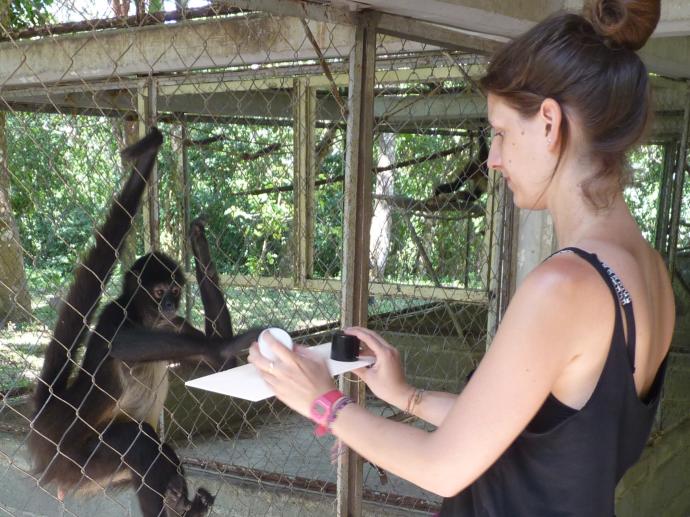
The test apparatus represented a two-choice paradigm in which the spider monkeys were allowed to choose between one of two colored cups that were presented to them (Figure 1), under one of which a food reward was hidden, and the other was left empty.
The animals were allowed to observe under which of the two colored cups the food item was placed before the apparatus was presented to them. The monkeys’ response in determining where the food reward was after it was covered by the cup assessed their object permanence abilities.
In order to avoid possible color biases, half of the animals were assigned one color (black), and the other half the other color (white), resulting in two possible combinations; 1) black cup with food item, and white cup without food, and 2) white cup with food item, and black cup without food.
For each animal, the number of correct and incorrect responses were recorded, which corresponded to selecting the cup with the food item or the empty cup, respectively. Ten trials formed one session, and a total of 60 trials, i.e. six sessions were performed with each individual.

Experiment 2 - Associative learning
As in Experiment 1, the animals were presented with the two-choice apparatus from which they were allowed to choose between one of two colored cups (Figure 1), under one of which a food item was hidden, and the other was left empty.
In this experiment, however, the animals were prevented from observing under which of the two colored cups the food item was placed, and which cup was left empty. As each individual was previously assigned either black or white as the color that was associated with a food reward (see Experiment 1), the animals’ ability to associate a color with the presence or absence of a food item could be used to assess their associative learning capacities (Figure 2).
For each animal, the number of correct and incorrect responses were recorded, which corresponded to selecting the cup with the food item or the empty cup, respectively. Ten trials formed one session, and a total of 200 trials, i.e. 20 sessions were performed with each individual.
Experiment 3 - Quantity discrimination
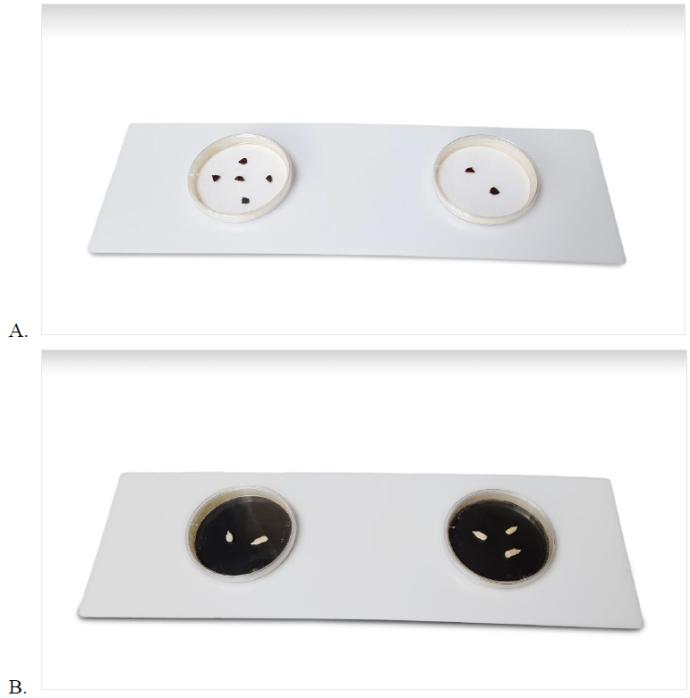
The test apparatus represented a two-choice paradigm in which the animals were allowed to choose between one of two petri dishes, which always contained varying quantities of food units (Figure 3).
The spider monkeys’ performance in recognizing two different quantities by selecting the petri dish with the higher number of food units allowed for the assessment of their discrimination abilities towards relative quantities.
Each monkey was presented with the following ratios of food items: 1:2, 1:3, 1:4, 1:5, 2:3, 2:4, 2:5, 3:4, 3:5, 4:5. These ratios represent the number of food pieces. The number of correct and incorrect responses were recorded, which corresponded to selecting the petri dish with the larger quantity of food items or the petri dish with the smaller quantity of food items, respectively. Each of the ten ratios mentioned above represented one trial, the ten trials represented one session, and a total of 300 trials, i.e. 30 sessions were performed with each individual.
Experiment 4 - Numerosity with equally-sized dots
The test apparatus represented a two-choice paradigm in which the animals were allowed to choose between one of two numbered boxes (Figure 4), where the box fitted with the card with the higher number of filled circles contained a food item, and the other was left empty. The sizes of the circles were adjusted as to have the same amount of black and white surface on each card in order to ensure that the choice of the animals was made according to the absolute number of circles and not according to the amount of surface covered by the black circles.
The spider monkeys’ performance in recognizing two different numerical properties by selecting the box with the higher numbered card allowed for the assessment of their numerical discrimination abilities towards discrete numbers.
Each monkey was presented with the following combinations of dots: 1:2, 1:3, 1:4, 1:5, 2:3, 2:4, 2:5, 3:4, 3:5, 4:5. The number of correct and incorrect responses were recorded, which corresponded to selecting the box fitted with the higher number of dots or the box fitted with the lower number of dots, respectively. Each of the number combinations represented one trial, the ten trials represented one session, and a total of 300 trials, i.e. 30 sessions were performed with each individual.

Experiment 5 - Numerosity with various-sized dots
The test apparatus, behavioral test and experimental design is this experiment were the same as for Experiment 4 (see above). However, in this experiment, the sizes of the filled circles were modified so that various-sized dots were present on a given card in order to control for the possibility that the animals would base their decision for one of the two options on the size of the dots rather than on their numerical properties (Figure 5). The overall surface that the black circles and the white background covered were still equal to ensure that the animals’ choice was made according to the absolute number of dots and not on amount of surface covered by the dots.

Experiment 6 - Long-term memory
The test apparatus used for this experiment was the same as for Experiments 1 and 2 (see above). With each spider monkey that had previously been assigned either black or white as the color to associate with a food reward (see Experiments 1 and 2), the animals were presented with the two-choice apparatus again at the end of all other experiments in order to test their long-term memory for a previously learned visual association. More specifically, the time between the end of the second experiment and the start of this experiment marked a four-month interval.
Therefore, this last experiment allowed to assess the animals’ long-term memory for the associative learning task that they had mastered previously.
One single session of ten trials was performed with each individual. A single trial may have resulted in the monkeys’ performance being at random, and more than one session may have allowed them to “relearn” the color combinations in the case that they did not remember them.
Data Analysis
In each trial of each experiment, the animals had two possible responses; to select the correct side, i.e. the rewarded side of the test apparatus, or to select the incorrect side, i.e. the non-rewarded side of the test apparatus. The learning criterion was set at 70% correct responses over two consecutive sessions, i.e. at least 14 correct responses over 20 trials (p<0.05, two-tailed binomial). The mean performances of the group across tasks were calculated in order to assess the direction and intensity of the trendlines, that is, of the potential progress of the group across sessions in each task (Spearman’s rho correlation test).
In the experiments involving test apparatuses with numerical properties (quantity discrimination, numerosity with equally-sized dots and numerosity with various-sized dots), the possible correlation between the animals’ performance and the task difficulty – in terms of how similar or different the discriminanda were – was also assessed (Spearman’s rho correlation test). The animals’ performance was again assessed in terms of percentage of correct responses, while the task difficulty was assessed according to the number of food items, or number of dots, the various combinations differed by. These corresponded to quantity or number combinations differing by one food item or dot (1:2, 2:3, 3:4, 4:5), by two food items or dots (1:3, 2:4, 3:5), by three food items or dots (1:4, 2:5), and by four food items or dots (1:5).
Responsible for this page:
Director of undergraduate studies Biology
Last updated:
06/01/20